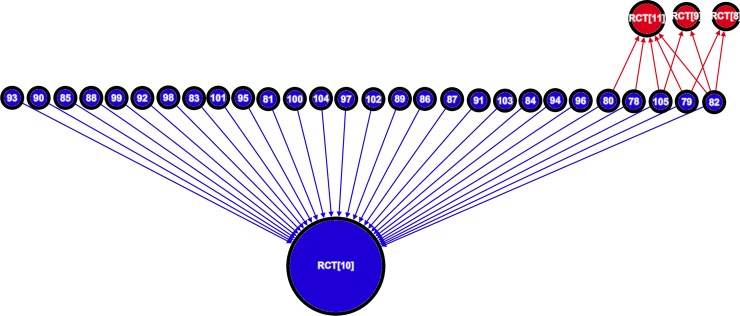
Fig 4. Sub-graph mapping the citations from supportive reviews to RCTs testing cholesterol lowering diets in the secondary prevention of CHD (n = 32; m = 37).
This graph is composed of four RCTs connected to 28 citing reviews by a total of 37 citations. Each vertex represents a paper and the integer label corresponds to a paper in the reference list. The colour of a vertex corresponds to a study’s classification (blue is supportive and red is unsupportive). Vertex size is proportional to in-degree (total number of incoming citations). Each edge corresponds to a specific citation link, the direction of the edge is established by the direction of the arrow head, and the colour of an edge indicates the classification of the cited article.

