Figure 5.
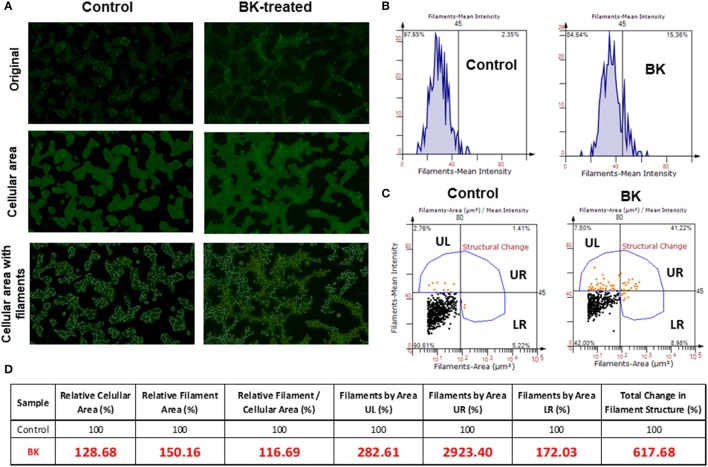
Rearrangements of the actin cytoskeleton in neuroblastoma cells induced by Bradykinin. (A) Fluorescence microscopy images are representative of actin filament staining with Alexa Fluor 488 phalloidin (original); images with cell area demarcation and with outstanding filaments. (B) Representative histograms of fluorescence intensity of actin filaments of control and BK-treated CHP-100 cells. (C) Quantitative analysis of change in filament structure (fluorescence intensity X cellular area) in neuroblastoma cells treated with 10 nM BK compared to control using Strata Quest software. The quadrants were divided as UL (small filaments that are intensely stained), UR (large filaments that are intensely stained), and LR (large filaments that are weakly stained). (D) Table of relative values analyzed parameters to identify changes in filaments structure. The experiment was repeated three times.

