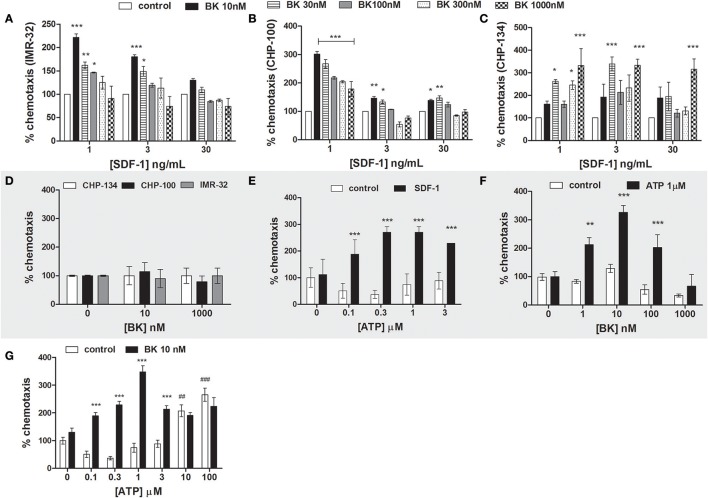
Figure 6.
Neuroblastoma chemotaxis. (A–C) Priming effect of increasing BK concentrations on neuroblastoma cell chemotaxis in response to stimulation with 1, 3, or 30 ng/ml SDF-1 (A: IMR-32; B: CHP-100 and C: CHP-134). (D) Chemotaxis of neuroblastoma cells (CHP-134, CHP-100, and IMR-32 cell lines) in response to BK treatment. Cells were seeded into the upper chamber of the transwell insert. The bottom part was filled with 0, 10, or 1,000 nM of BK in 0.2% BSA. (E) Priming effect of increasing ATP concentrations on CHP-100 neuroblastoma cell chemotaxis in response to stimulation with 3 ng/ml SDF-1. (F) Priming effects of 1 μM ATP on CHP-100 neuroblastoma cell chemotaxis in response to stimulation with increasing concentrations of BK. (G) Priming effect of 10 nM BK on t CHP-100 neuroblastoma cell chemotaxis in response to ATP stimulation. The experiments were done at least three times *p < 0.05; **p < 0.01, and ***p < 0.001 compared to the corresponding dose in the control group. ##p < 0.01 and ###p < 0.001 compared to control without ATP.

