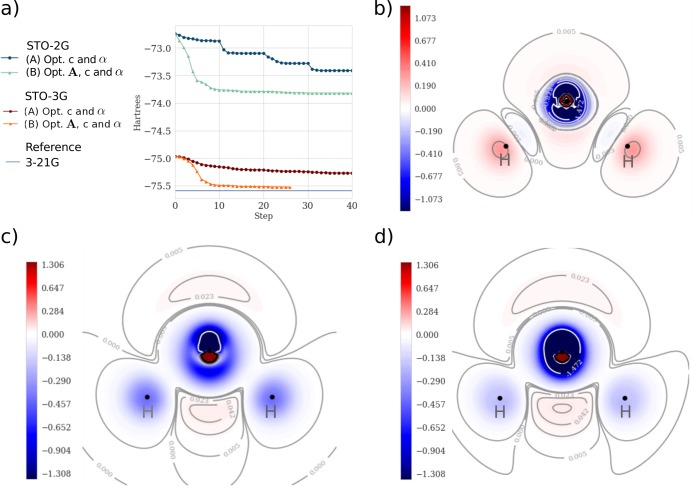
Figure 3.
One-electron basis function optimizations of H2O. (a) Optimization steps of STO-3G and STO-2G with different optimization schemes. (A) Optimizing exponents and coefficients 10 steps each twice, and (B) optimizing exponents and coefficients together, followed by optimizing positions. (b) Contour of the difference in electronic density between the STO-3G basis and the optimized one-electron basis functions under scheme (B). (c) Contours of the difference in electronic density between the conventional STO-3G basis set and the reference 3-21G basis set. (d) Contour of the difference in electronic density between the optimized (scheme (B)) STO-3G basis set and the reference 3-21G basis set. An increase of density on the optimization is displayed in blue and a decrease is in red.

