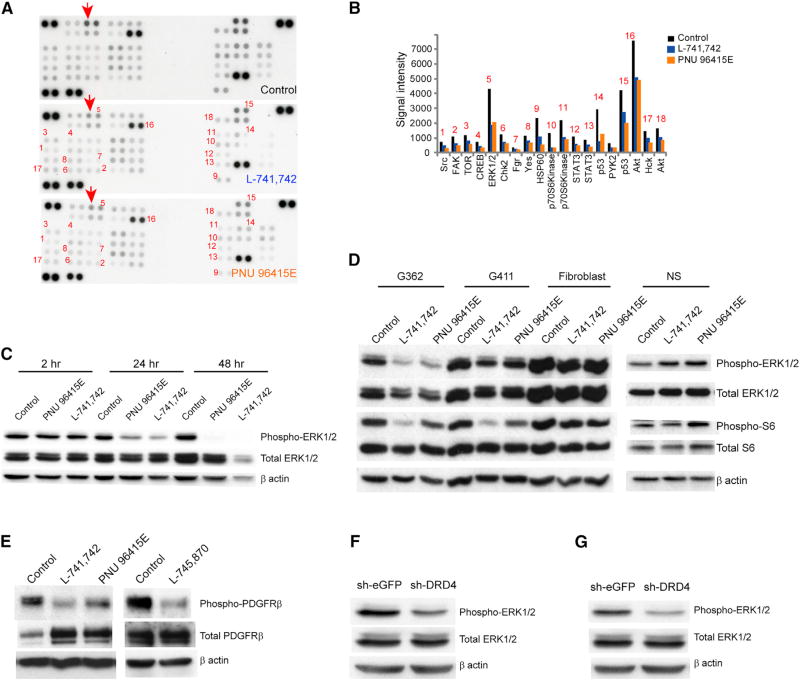
Figure 6. Phosphokinase Array Reveals Suppression of ERK1/2 and mTOR Pathway Upon DRD4 Antagonism.
(A) Dot blot containing 43 phosphoproteins in duplicates after exposure to lysate of G362 cells treated with L-741,742 (10 µM) and PNU 96415E (25 µM) and DMSO for 24 hr. Red arrow indicates one of a paired spot for ERK1/2.
(B) Signal intensity of each spot corresponding to each phosphoprotein (average of two spots) in (A) that changed upon treatment compared with DMSO. Signal intensity was quantified using ImageJ.
(C) Western blot analysis for anti-phospho-ERK1/2, anti-total ERK1/2, and anti-β-actin in G362 cells treated with L-741,742 (10 µM) and PNU 96415E (25 µM) at indicated time intervals.
(D) Western blot analysis for anti-phospho-ERK1/2 and anti-total ERK1/2, anti-phospho-S6 and anti-total S6, and anti-β-actin in GNS (G362 and G411), fibroblast (BJ), and NS (hf5205) treated with L-741,742 (10 µM) and PNU 96415E (25 µM) for 48 hr.
(E) Western blot analysis for anti-phospho-PDGFRβ, anti-total PDGFRβ, and anti-β-actin in G411 cells treated with L-741,742 (10 µM), PNU 96415E (25 µM), and L-745,870 (15 µM) for 48 hr.
(F and G) Western blot analysis for anti-phospho-ERK1/2 and anti-total ERK1/2 in G362 (F) and G481 (G) transiently transfected with sh-DRD4 and control sheGFP after 72 hr (same protein lysates from Figures 3E and S2H).
See also Figure S5.

