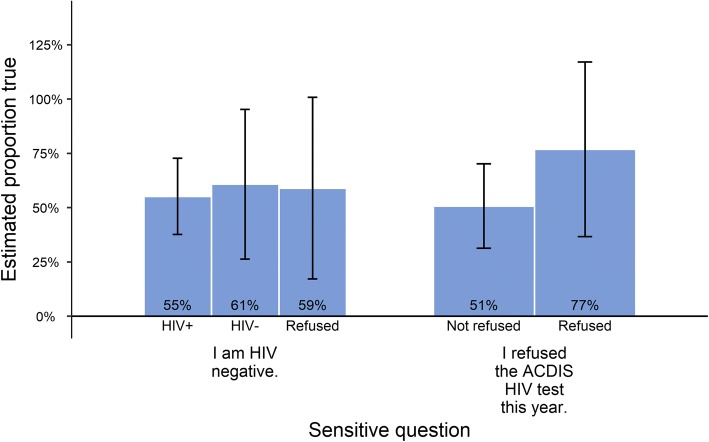
Fig. 4.
Estimated percentage affirmative by true status. Bars show the estimated percentage of the population answering “true” (affirmative) to the sensitive question. Subpopulations by HIV test status are shown by bar colors. 95% confidence interval in brackets. True status as shown in this chart is known to the researchers, but may not necessarily be known to the individuals

