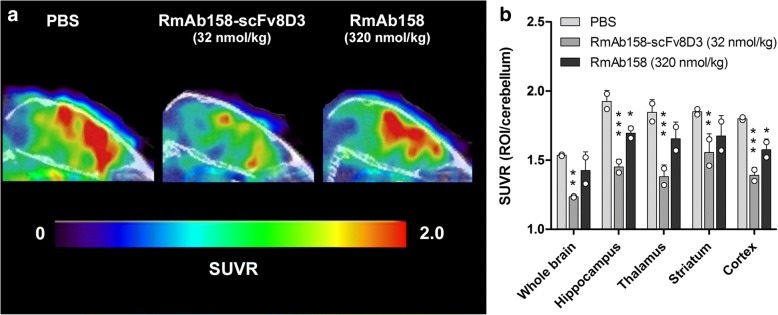
Fig. 4.
Positron emission tomographic (PET) imaging after pretreatment (blocking) with PBS, RmAb158-scFv8D3, or RmAb158. a Sagittal view of PET images (standardized uptake value ratio [SUVR] normalized to the reference region, the cerebellum) obtained with [124I]RmAb158-scFv8D3 administered to 18-month-old tg-ArcSwe mice 3 days after injection with PBS (n = 2), 32 nmol/kg RmAb158-scFv8D3 (n = 2), or 320 nmol/kg RmAb158 (n = 2). b Quantification of SUVR (ROI/cerebellum) from PET images in (a) for whole brain, hippocampus, thalamus, striatum, and cortex. Graph displays scatterplot with bars representing group mean and error bars for SD. * p < 0.05, ** p < 0.01, and *** p < 0.001 in comparison with the PBS group by two-way analysis of variance and Dunnett’s post hoc test

