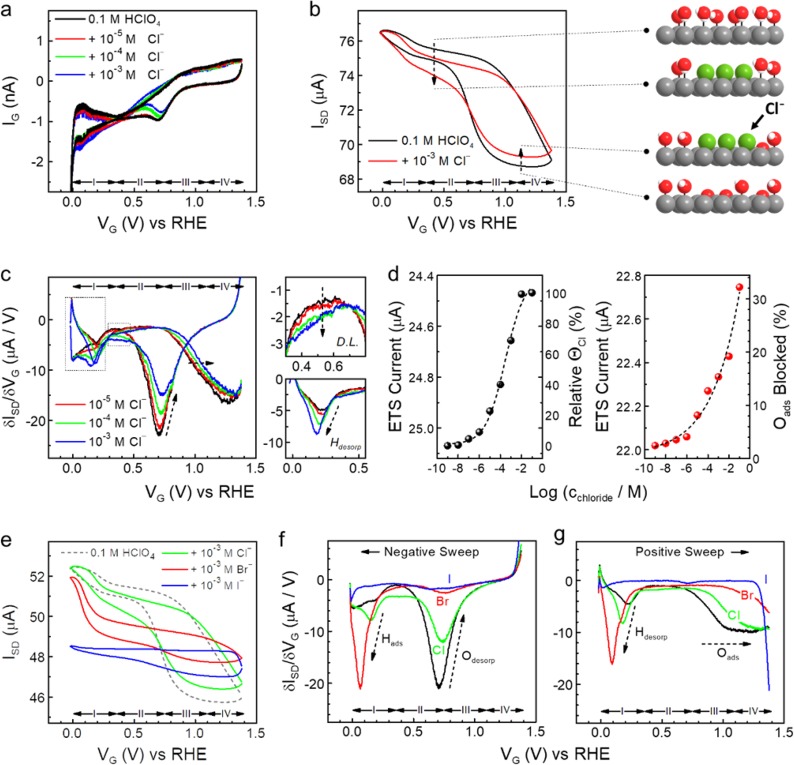
Figure 3.
In situ ETS study of halide adsorption on Pt surface. (a) On-chip CV characteristics of a typical PtNW device in 0.1 M HClO4 (black) and with addition of varying concentrations of sodium chloride. Redox regions of hydrogen adsorption (region I); the double layer (D.L.) (region II), reversible adsorption of OH (region III), and surface oxide formation (region IV) can be identified. (b) ETS characteristics of a typical PtNW device in 0.1 M HClO4 (black) and with addition of 1 mM chloride anions (red). Dashed arrows indicate the change of ETS by the effect of chloride adsorption in double layer and oxidation regions, with corresponding illustrations of the surface adsorption models on the side. Pt atoms are gray, H atoms are white, O atoms are red, Cl atoms are green. (c) Differentiated ETS (dETS) results of PtNWs with varying chloride concentrations. Insets on the right depict the enlarged spectra at double layer and hydrogen desorption regions (dashed areas on the left). (d) ETS current of the PtNWs device in D.L. (left, value obtained at 0.5 V vs RHE) and oxidation (right, value obtained at 0.9 V vs RHE) regions at different chloride concentrations. Black dashed curves are sigmoidal (left) and exponential (right) fittings of the current values. Electrically derived surface coverage of Clads at the D.L. region and percentage of blocked Oads by Clads in oxidation region are given at the corresponding right axis. (e) ETS characteristics of a typical PtNW device in 0.1 M HClO4 (dashed black, as baseline comparison) and with addition of 1 mM chloride (green), bromide (red) and iodide (blue) anions. (f, g) dETS characteristics of halide adsorptions, results from negative (f) and positive (g) potential sweep are divided for the clarity of the comparison.

