. 2015 Dec 11;7(3):2074–2083. doi: 10.1039/c5sc04295j

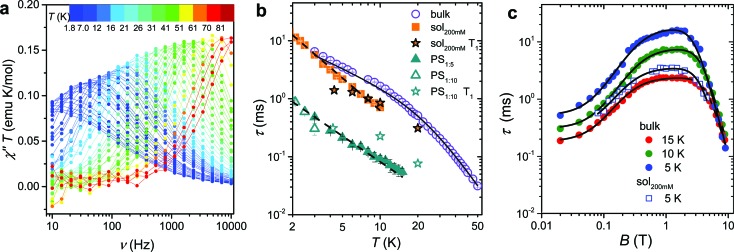
Fig. 2. (a) Frequency dependence of the imaginary component of the AC susceptibility of 1bulk in Bdc = 0.2 T multiplied by temperature to be readable in the whole 2–80 K temperature range. (b) Temperature dependence of the relaxation time of the magnetic susceptibility measured in Bdc = 0.2 T for the pure and the diluted samples of 1: two dispersions in polystyrene with 1 : 5 and 1 : 10 mass ratio and a 200 mM CH2Cl2 : toluene frozen solution (see legend). The black solid line corresponds to the best-fit of 1bulk data using eqn (1), while the broken lines correspond to simulation with Tn law. T1 for the diluted sample, extracted from pulsed EPR spectra, are shown for comparison. (c) Field dependence of the relaxation time of the magnetic susceptibility of 1bulk and 1sol200 mM frozen solution sample (see legend). The solid lines represent the best fit obtained with eqn (3). Best fit parameters are reported in Table 1.

Fig. 2