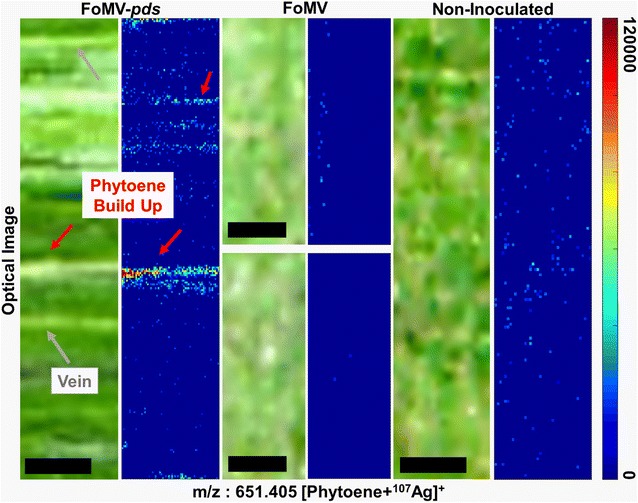
Fig. 6.

Mass spectrometry (MS) images of fractured FoMV-pds silenced, FoMV and non-inoculated maize leaves. The images are generated using the phytoene mass-to-charge (m/z) ratio 651.405, which is a silver adduct [Phytoene + 107Ag]+. The ion intensity is shown using the color scale shown on the right. The leaf vein(s) were identifiable (gray arrows) because they were present along the entire length of the leaf. The FoMV-pds silenced variegated white areas (red arrows) however were not present along the entire length of the leaf. The resolution of the camera collecting the optical images on the MSI instrument is low, however an additional optical image collected prior to imaging is provided in Additional file 1: Fig. S8. Scale bar is 500 µm for all images
