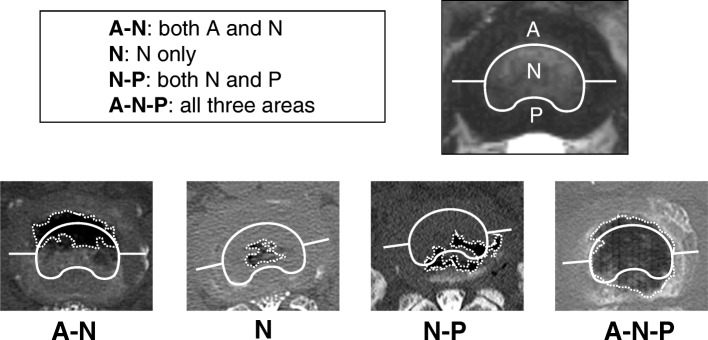
Fig. 2.
Distribution of vacuum phenomena. The distribution of vacuum phenomena (VPs) was classified using axial imaging by multi-detector computed tomography (MDCT). The intervertebral disc (IVD) was divided into three areas (nucleus pulposus: N; anterior annulus fibrosus: A; and posterior annulus fibrosus: P). Then, the distribution of intradiscal VPs was classified into four groups using combinations of these areas

