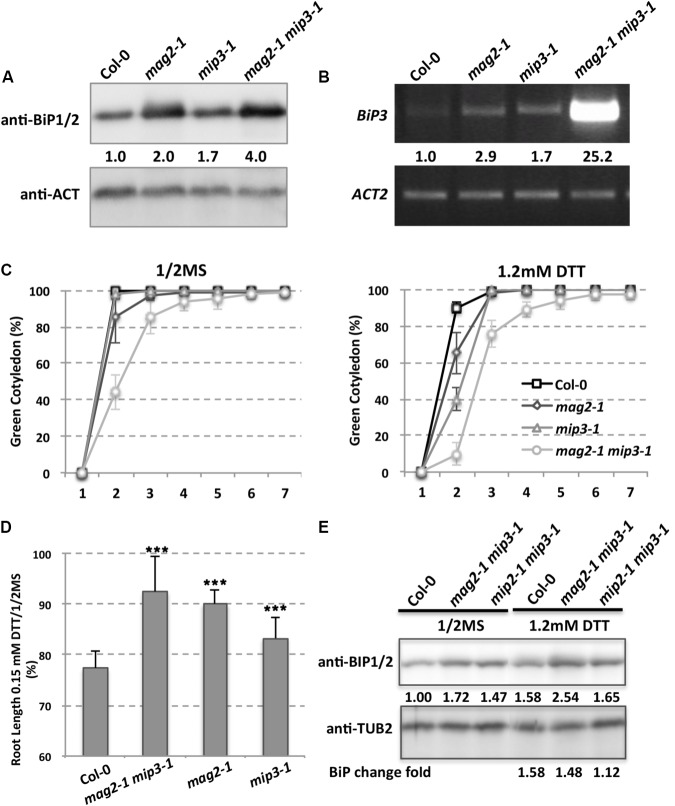
FIGURE 3.
ER stress is induced in the mutants. (A) Immunoblot of dry seeds of wild type, mag2-1, mip3-1 and mag2-1 mip3-1, with anti-BiP1/2 antibodies. Statistics for BiP1/2 protein accumulation in seeds are shown in numbers below the bands BiP/control (ACT or TUB, actin or tubulin) band concentration, measured by ImageJ, the same below). Three independent experiments per sample. (B) BiP3 expression was detected by RT-PCR on 9-day-old seedlings using BiP3 specific primers. Statistics for BIP3 expression level are shown in numbers below the bands. n = 3. Three independent experiments per sample. (C) Quantitative analysis of germination ratio (Green cotyledon ratio, the same below) of wild type, mag2-1, mip3-1 and mag2-1 mip3-1 on 1/2MS medium (left) or 1/2MS medium with 1.2 mM DTT (right). n = 72, three independent experiments per sample. (D) Root length change fold (treated/non-treated) of 7-old-seedlings of wild type, mag2-1 mip3-1 and mip2-1 mip3-1 on 1/2MS medium (non-treated) and 1/2MS medium with 0.15 mM DTT (treated). (E) Immunoblot on DTT treated 7-day-old seedlings of wild type, mag2-1, mip3-1 and mag2-1 mip3-1 on 1/2MS medium (left panel) or 1/2MS medium with 1.2 mM DTT (right panel) with anti-BiP1/2 antibody. Statistics of BiP1/2 protein level are shown below the bands. Change fold (treated/non-treated, the same below) is indicated in the lowest panel.

