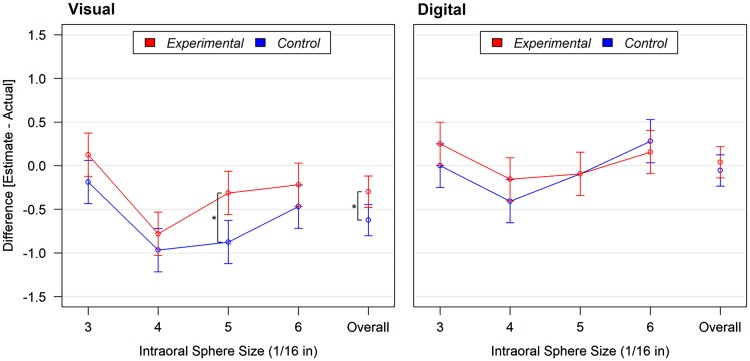
Figure 1.
Comparisons between the control and experimental groups on differences between the visual (left panel) or digital assessment (right panel) estimate and intraoral sphere size by intraoral size and overall. Overall category is the mean difference between the estimate and actual size across all four different intraoral sphere sizes. *p ≤ .01.

