Figure 1.
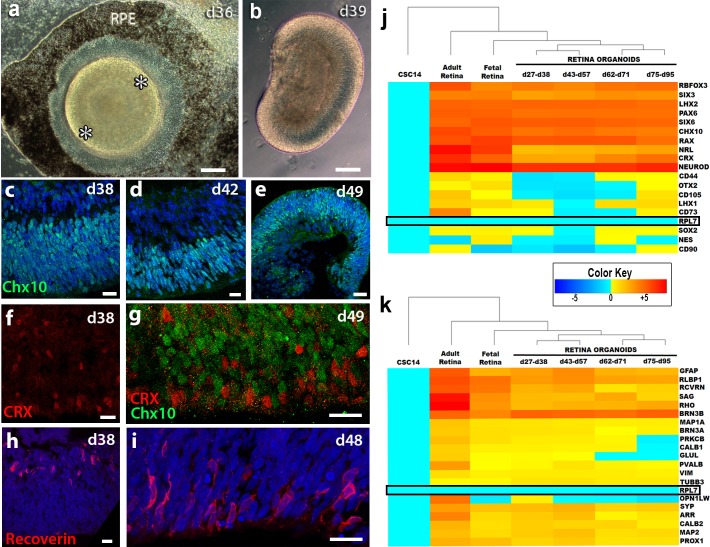
Characterization of retina organoids in vitro. (a) Phase contrast image of retina organoid (RO) in 2D culture at day 36 of differentiation prior to cutting out of dish. A pigmented RPE monolayer can be seen surrounding the organoid. The developing neuroretina is comprised of a raised ridge of cells (white asterisks). (b) Phase contrast image of RO in 3D suspension culture at day 39 of differentiation. A laminar organization can be recognized and the cells themselves are translucent. (c–e) Chx10 expression within day 38, day 42, and day 49 3D ROs. (f) CRX is found as early as day 38 in developing ROs. (g) CRX+ cells at day 49 are localized mostly in the apical region of the organoid and are restricted to a different population than Chx10+ progenitors. (h–i) Recoverin+ cells appear as early as day 38 with basal expression and are later restricted to the apical region by day 48. (j) qPCR of genes critical to retinogenesis and photoreceptor production. Fold expression clustergram comparing adult human retina (n = 5), human fetal retina (n = 4), and stem cell-derived retina organoids at various days of differentiation age ranges (n = 5 to 6). RO tissues are organized according to 2D adherent (27–38 days), in early 3D culture (43–57 days), continued 3D culture (62–71 days), and extended 3D culture (75–95 days). There is temporal progressive differentiation of hESCs into retinal tissue. Normalized to day 0 hESC controls (CSC14) and RPL7 (boxed with black outline) as the housekeeping gene. The dendrogram tree on top was generated using nearest neighbor linkage. The heatmap color key ranges ±5. (k) qPCR analysis of retinal subpopulations. Many of the cell types that are critical to transplant success and future synaptogenesis are present within the retinal organoid sheet. Ganglion (BRN3A), amacrine (CALB2), horizontal (CALB1), and Müller (GFAP and GLUL) cell populations are alive within the tissue. (c–e, h, i) Nuclei are stained blue with DAPI. (a, b) Scale bar: 200 μm. (d–g) Scale bar: 50 μm.

