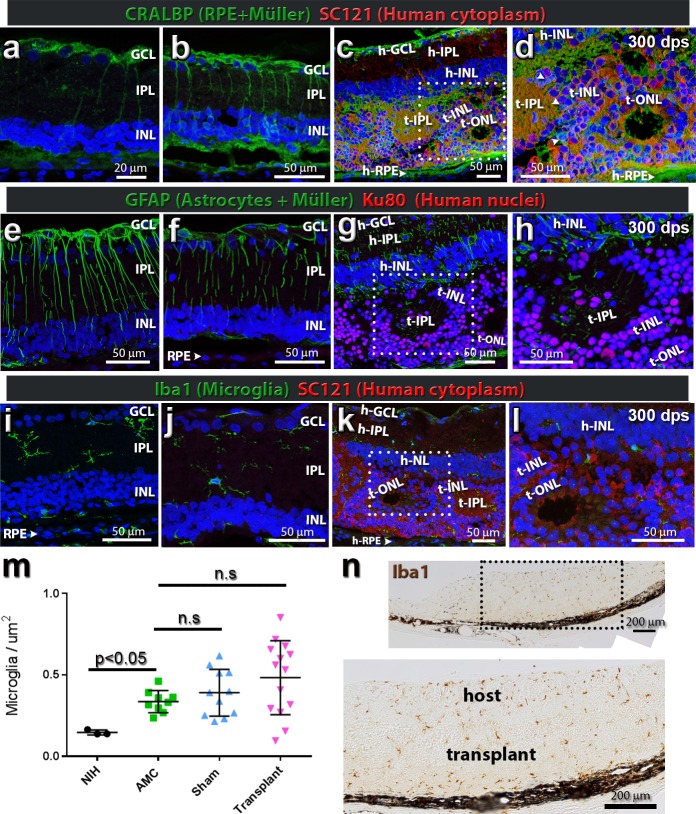
Figure 3.
Glial cell and immune response to RD and transplantation. (a–d) CRALBP expression (green) with normal protein localization in Müller cells and RPE, as seen in (a) postnatal day (P)30 RD and (b) sham surgery at 169 dps. (c, d) At 300 dps, a transplanted RD animal shows the host Müller cells integrating with the SC121+ donor tissue (red). (d) Boxed area in panel (c). There is some suggestive colabeling of CRALBP, with SC121 indicative of donor-derived Müller glia (arrow heads). (e–h) GFAP expression in a P30 RD rat (e) (time of transplantation), (f) sham surgery at 169 dps, and (g, h) transplanted animals. GFAP levels increased in the host Müller cells in response to the underlying RD, surgery trauma, and transplant tissue. Donor nuclei in (g, h) are Ku80+ (red). There are host Müller cell projections reaching into the retinal sheet and they interact with Ku80+ transplant cells. (i–l) Iba-1-immunoreactive microglia (green) (i) in the nontransplanted P31 nude RD retina microglia are restricted to the IPL and choroid (n = 3). Microglia cells are mostly negative for major histocompatibility complex II and CD68 (data not shown). (j) Sham surgery (n = 4) (example shown is 181 dps). (k–l) Transplanted recipient animals (n = 9) (example shown is 300 dps). SC121 immunoreactivity of the human donor cytoplasm (red) defines host/donor boundary. The resident microglia populations can be found in the IPL and areas of surgical damage. Occasionally, microglia can be found within transplant rosettes (not shown). Images are oriented with the GCL on top and RPE layer on the bottom. In all panels, nuclei are stained blue with DAPI. Scale bars: 50 μm, except for (a) (20 μm). (m) Quantification of Iba-1 counts: Iba1+ cells were counted per section, normalized to retinal area (μm2), averaged over three adjacent sections and organized into the four following categories: NIH non-RD controls (n = 3), RD AMC (n = 9), RD sham rats (n = 11), and RD transplant rats (n = 19). The only significant difference was between NIH non-RD controls and AMC (P < 0.05). AMC versus SHAM, AMC versus transplant, and NIH versus surgery were nonsignificant (P > 0.05). (n) Representative Iba1 DAB-stained section (transplant no. 7). Transplant is shown with brown Iba1+ cells seen within the transplant and host retina. Scale bar: 200 μm.

