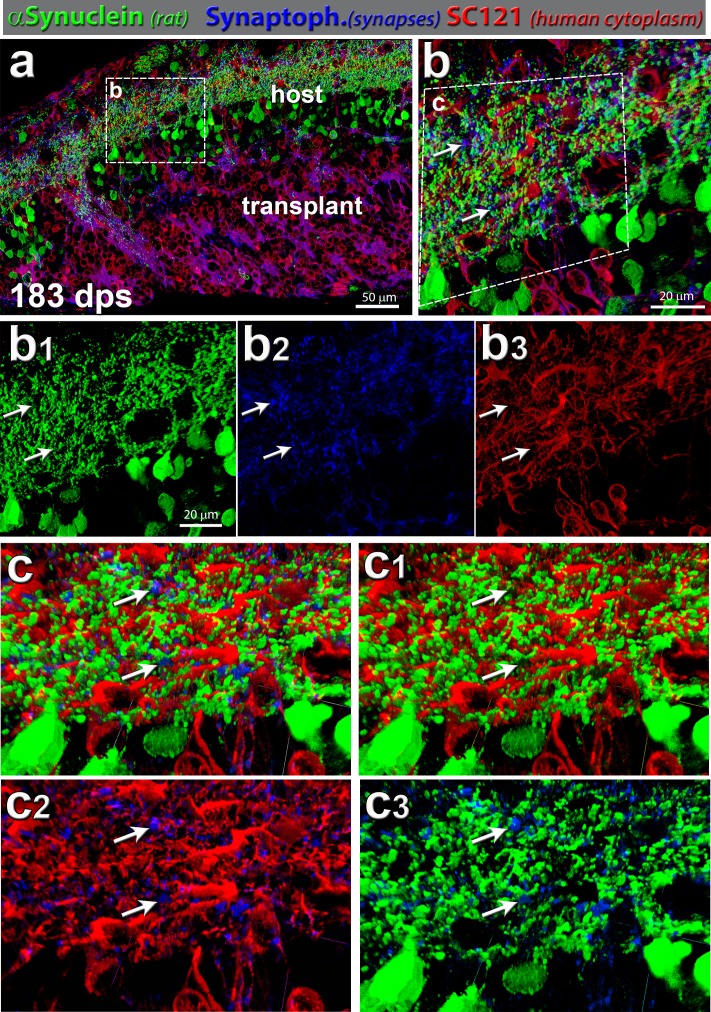
Figure 8.
Synaptic connectivity: rat-specific α-synuclein (green), synaptophysin (blue), and SC121 (human cytoplasm, red). (a) Transplant processes (SC121, red) were well integrated within host retina (rat α-synuclein, green) and showed functional connectivity, which was evident with synaptophysin (blue) labeling in transplant (red) and host (green). This transplant shown (no. 7) had a strong SC light response. It was highly integrated at the host/donor interface. Area of enlargement in (b) is indicated by a white dashed box. (b) Magnification within host IPL: synaptophysin punctate expression can be found uniformly throughout the area of interest (n = 8). Arrows indicate two areas with close contact of blue, green, and red channels (same area indicated in the single channels (b1, b2, b3). (b1) Green channel (rat α-synuclein), (b2) blue channel (synaptophysin), and (b3) red channel (human cytoplasm, SC121). (c) Volocity 3D images of host IPL enlargement in (b). The white arrows indicate the same areas as in (b). (c) All three channels (red-green-blue); (c1) red-green, (c2) red-blue, and (c3) green-blue.

