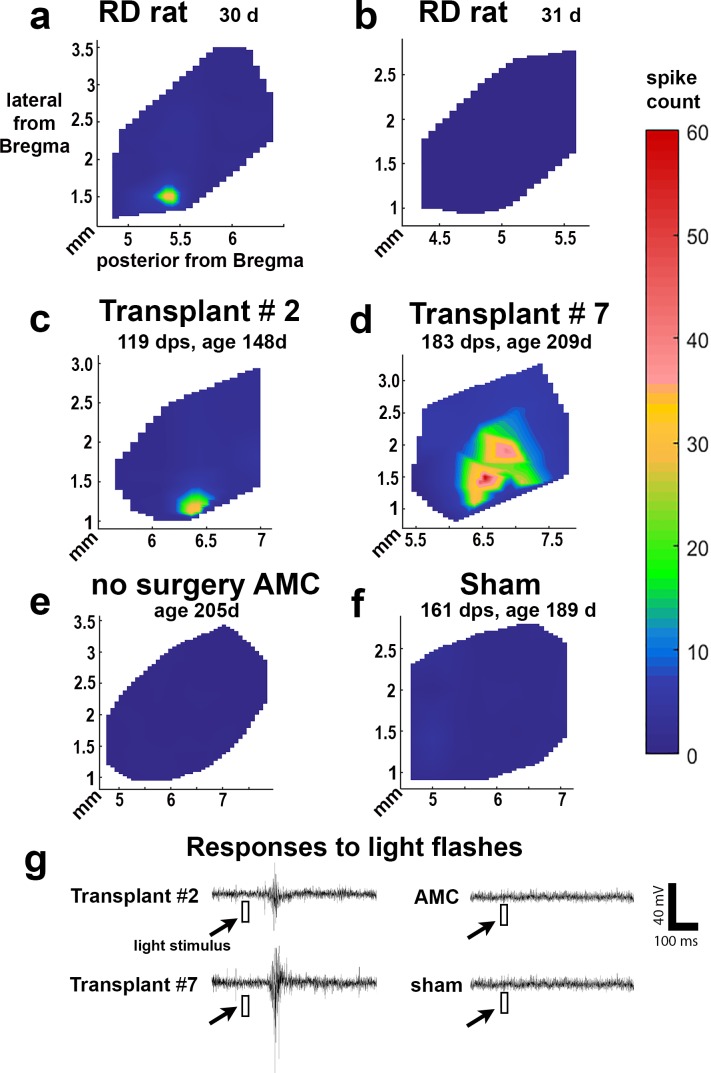
Figure 10.
Electrophysiologic recording in SC, increased responses in transplanted rats (Tables 2, 3). Representative spike count heatmaps. (a) 1-month-old RD rat with small response and (b) 1-month-old RD rat with no response in the entire SC. The light response could be found in a very small area of SC. Such responses were only found in three of six animals (Table 3). (c, d) Selected transplants show responses in a limited area of the SC. (e) A nonsurgery AMC, and (f) sham surgery. No response was found in the entire SC area of nonsurgery AMCs and sham rats. (g) Example traces of experiments in (a–d) are representative from either the location with the strongest response in transplant rats (c, d) or a random location in nonsurgery AMC and sham rat. The light stimulus (10 msec) is indicated as a white square. The scale bar applies to all traces and the color bar applies to all heatmaps.

