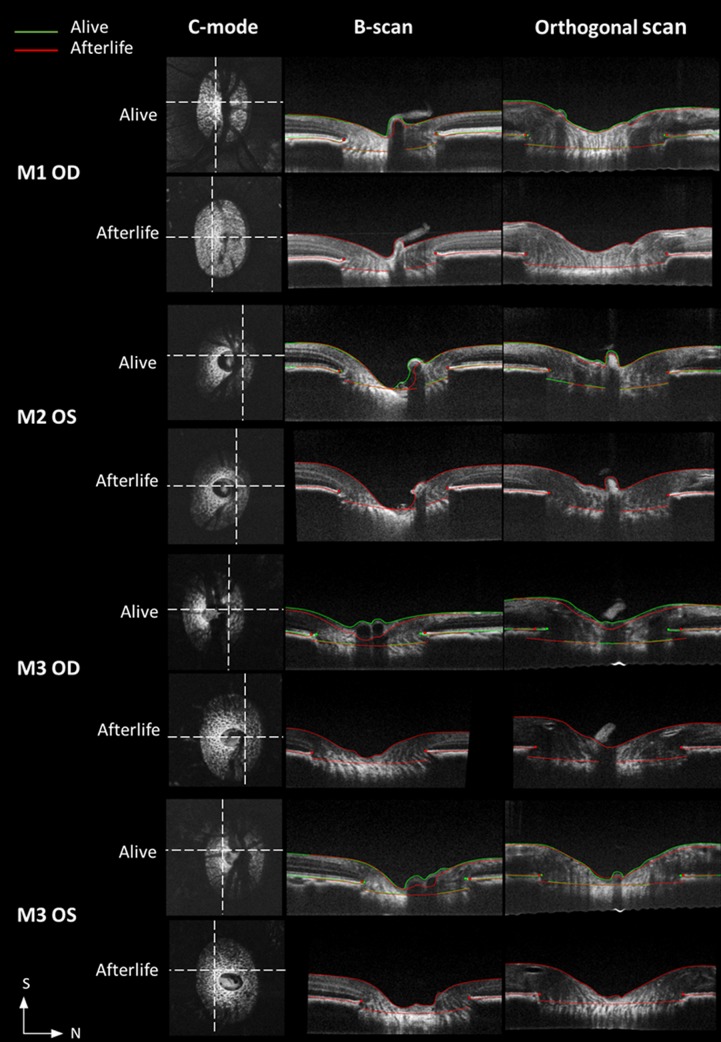
Figure 5.
Example OCT cross-sections, including C-mode, B-scan, and orthogonal views, for visualizing the ONH and its differences between alive and after life conditions. The longitudinal views are shown with overlaid markings at both alive (green) and after life (red) conditions. Locations of corresponding longitudinal sections are denoted on C-mode view (dashed lines). S, superior; N, nasal.

