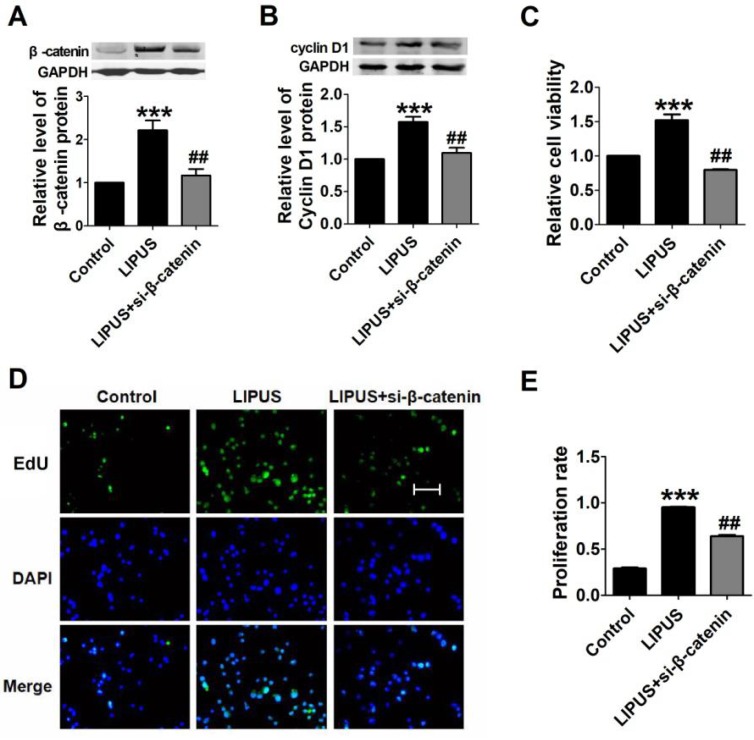
Figure 8.
Results of blocking β-catenin. (A). The relative protein of β-catenin. (B). The relative protein of Cyclin D1. (C) The cell viability detected with MTT assay. ***p <0.001 vs Control, ##p <0.01 vs LIPUS; mean ± SEM. n=3. (D). The EdU staining of co-treated with β-catenin siRNA. (E). Quantification of the EdU staining. ***p <0.001 vs Control, ##p <0.01 vs LIPUS; mean ± SEM. n=3.

