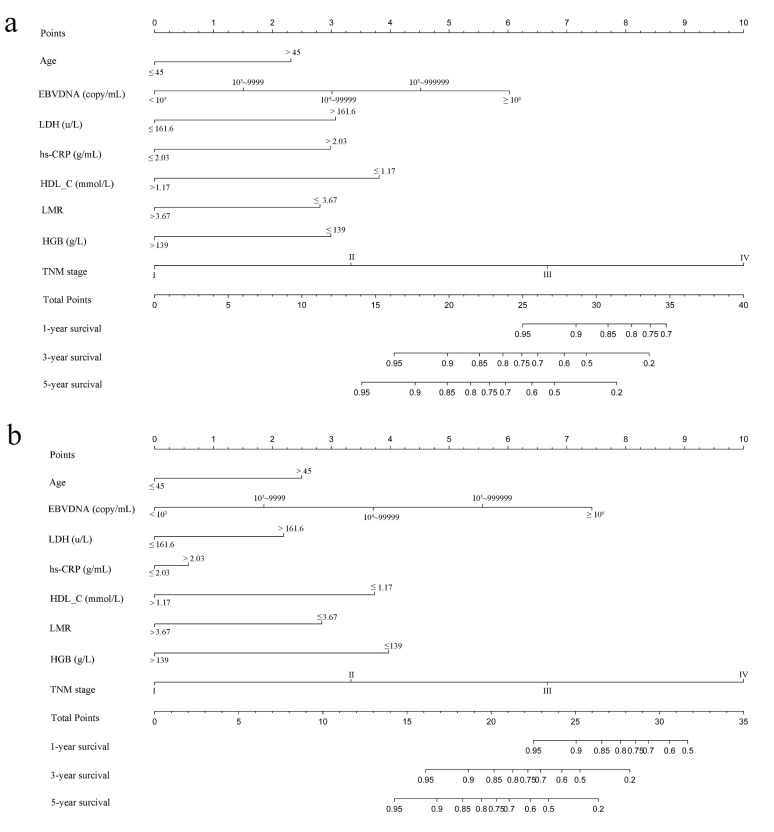
Figure 1.
Nomogram model predicting 1-, 3- and 5- year OS in NPC patients. The nomogram was used summing the points identified on the points scale for each variable. The total points projected on the bottom scales indicate the probability of 1-, 3- and 5-year survival. a: The nomogram of primary cohort; b: The nomogram of validation cohort;

