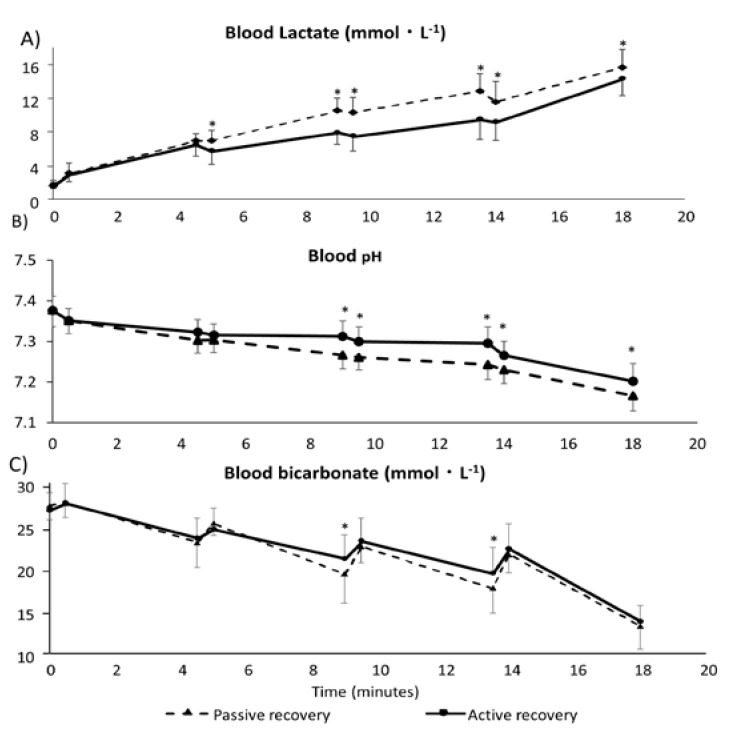
Figure 2.
Blood lactate, blood pH, and blood bicarbonate during the main tests. (A) Blood lactate (mmol/L), it was significantly higher during the PR trials, and in both conditions significantly decreased during the last two 30 s bouts and the WT. (B) Blood pH, it was gradually decreased during the whole exercise, and statistical differences were found between conditions for measurements after the first 4 min recovery. (C) Blood bicarbonate (mmol/L), it was significantly different between the two trials: before the third 30 s bout and before the WT. Black bars indicate standard deviation. * p-values lower than 0.01.

