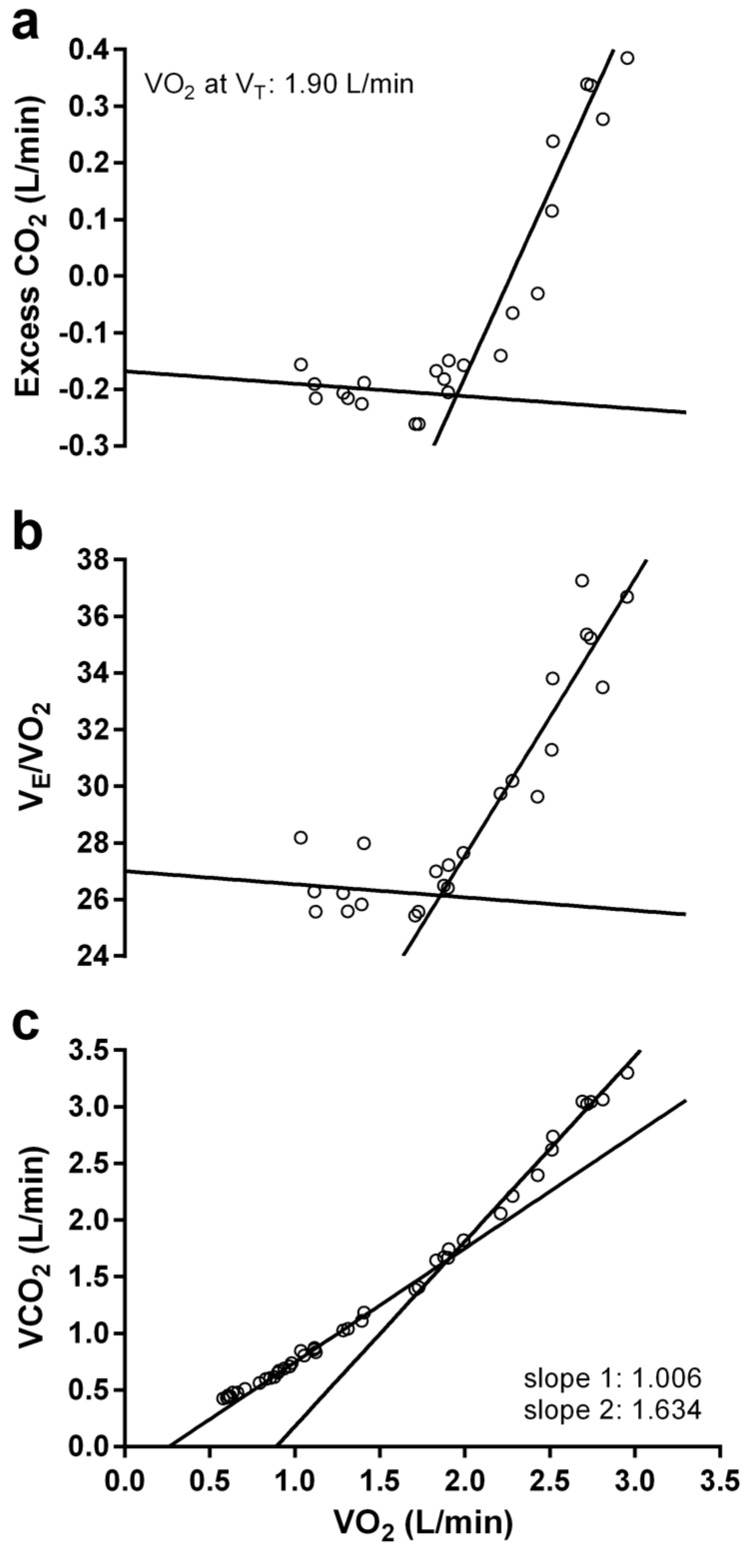
Figure 1.
Representative illustration of computer plots showing agreement between the (a) excess CO2 (ExCO2); (b) ventilatory equivalent (VEQ); and (c) modified v-slope methods for determination of the ventilatory threshold (VT) using expired gas data. Open circles indicate 20 s average expired gas data points and solid lines indicate regression lines fitted to the pre-VT and post-VT segments of the data set.

