Figure 3.

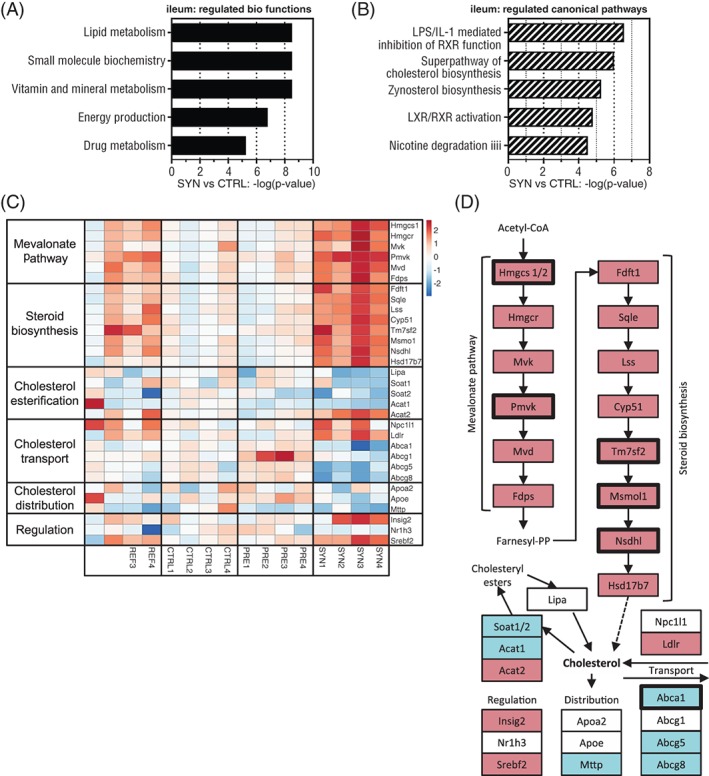
Early life synbiotics affect cholesterol metabolism in the ileum on PN98. The 5 most strongly regulated regulated biological functions (A) and canonical pathways (B) in the SYN vs CTRL comparison in the ileum, determined by Ingenuity Pathway Analysis (IPA) of differential expressed genes (q ≤ .05). (C) Heatmap of selected gene sets related to cholesterol biosynthesis, esterification, transport, distribution and regulation, indicating relative gene expression (signal intensities per sample normalized to the mean of the CTRL group in the REF, CTRL, PRE and SYN groups as color gradient: red, higher expression than mean of CTRL; blue, lower expression than mean of CTRL). (D) Schematic overview of cholesterol biosynthesis pathway, transport, distribution and regulation. Up‐regulation (red) and down‐regulation (blue) are indicated for genes with P ≤ .05 in SYN vs CTRL comparison. Bold frames indicate significantly altered genes after FDR adjustment (q ≤ .05). White boxes indicate non‐significant genes (P > .05). For more information see Table S3
