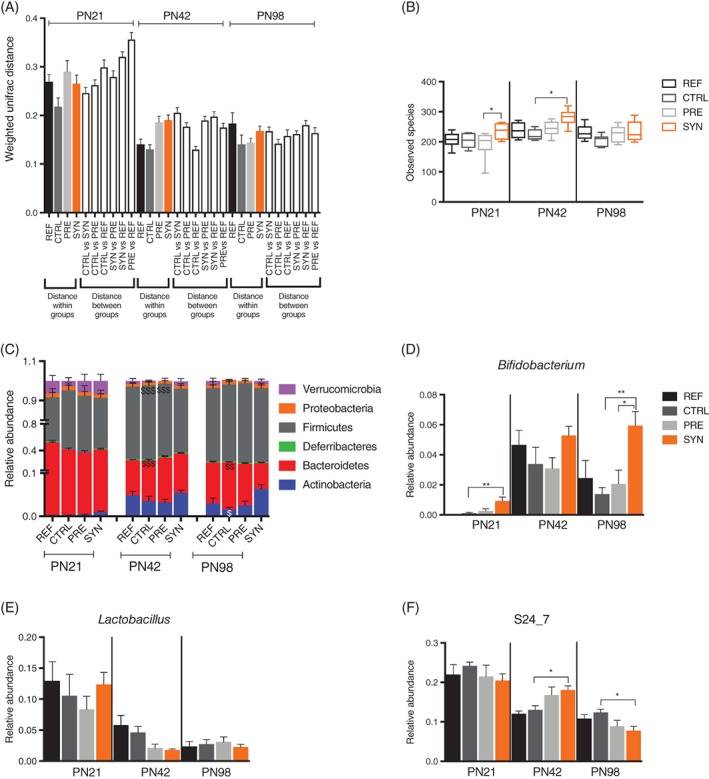
Figure 4.

Early life synbiotics modulate early life microbiota. A, Weighted Unifrac distances showing distance within and between groups in the REF (n = 7), CTRL (n = 7), PRE (n = 8) and SYN (n = 11) groups of mice. B, Bacterial diversity as shown by diversity box plots obtained from alpha rarefaction measured by observed species. Data are shown as box and whiskers plots, indicating the median (thick line in the box), the 25th to 75th percentile range (boxes), and the 1st to 99th percentile range (whiskers). Relative abundance of major phyla (C), Bifidobacterium (D) Lactobacillus (E) and S24_7 (F) in the REF (n = 7), CTRL (n = 7), PRE (n = 8) and SYN (n = 11) groups of mice. Data are given as mean ± SEM. In (C), two‐way analysis of variance, followed by Tukey's multiple comparisons test. $ P < .05, $$ P < .01, $$$ P < .001 indicate significance between the CTRL and SYN groups. In (D) to (F), non‐parametric the Kruskal‐Wallis test, followed by Dunn's multiple comparisons test. *P < .05, **P < .01 as indicated
