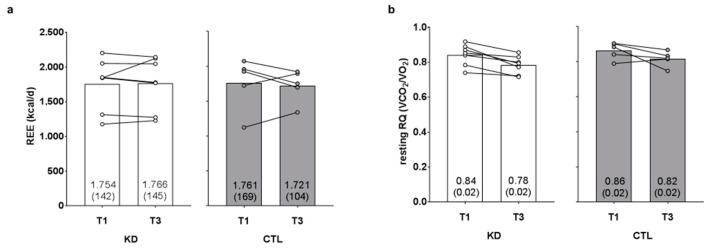
Figure 3.
Effects of the intervention on resting energy expenditure and respiratory quotient values. Resting energy expenditure (REE) and resting respiratory quotient (RQ) values are presented in panels (a,b). Data are presented as group means accompanied by individual participant values, and means (±SE) values are indicated at the bottom portion of each bar. Abbreviations: KD, ketogenic diet; CTL, control diet; T1, baseline testing; T3, 12-week post-testing.

