
Figure 2.
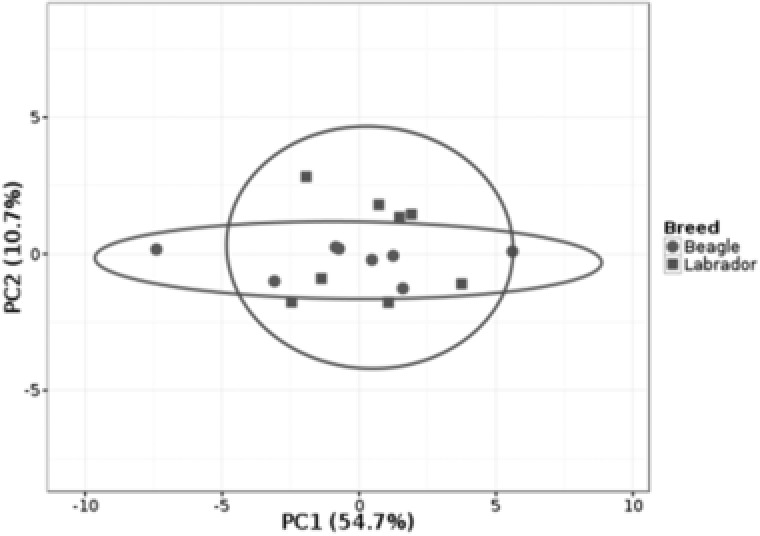
Principle component analysis of all dog saliva samples as analyzed for eight individuals per breed as in Figure 1. No scaling is applied to rows; NIPALS PCA is used to calculate principal components. X and Y axis show principal component 1 and principal component 2, respectively that explain 54.7 and 10.7% of the total variance, respectively. Prediction ellipses are such that with probability 0.95, a new observation from the same group will fall inside the ellipse. N = 16 data points.