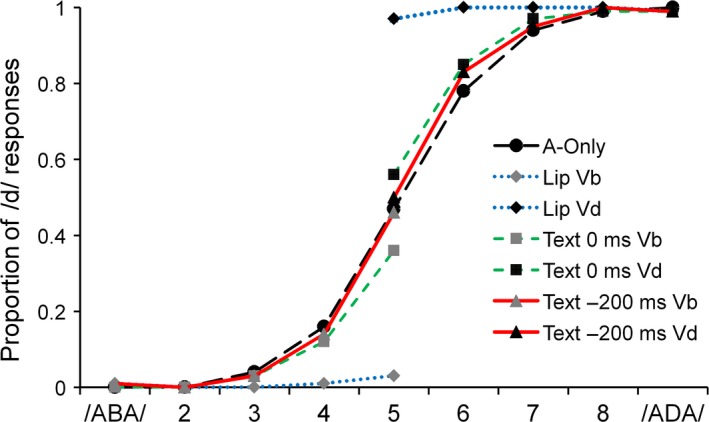
Figure 2.

Proportion of /ada/ responses on the auditory continuum (/aba/ to /ada/) for the conditions auditory‐only (A‐only); visual speech ‘aba’ (Lip Vb) and visual speech ‘ada’ (Lip Vd) with synchronized audiovisual onset; text ‘aba’ (Text 0 ms Vb) text and ‘ada’ (Text 0 ms Vd) with synchronized audiovisual onset; text ‘aba’ (Text −200 ms Vb) and text ‘ada’ (Text −200 ms Vd) with visual onset to auditory onset lead of 200 ms. [Colour figure can be viewed at http://www.wileyonlinelibrary.com/].
