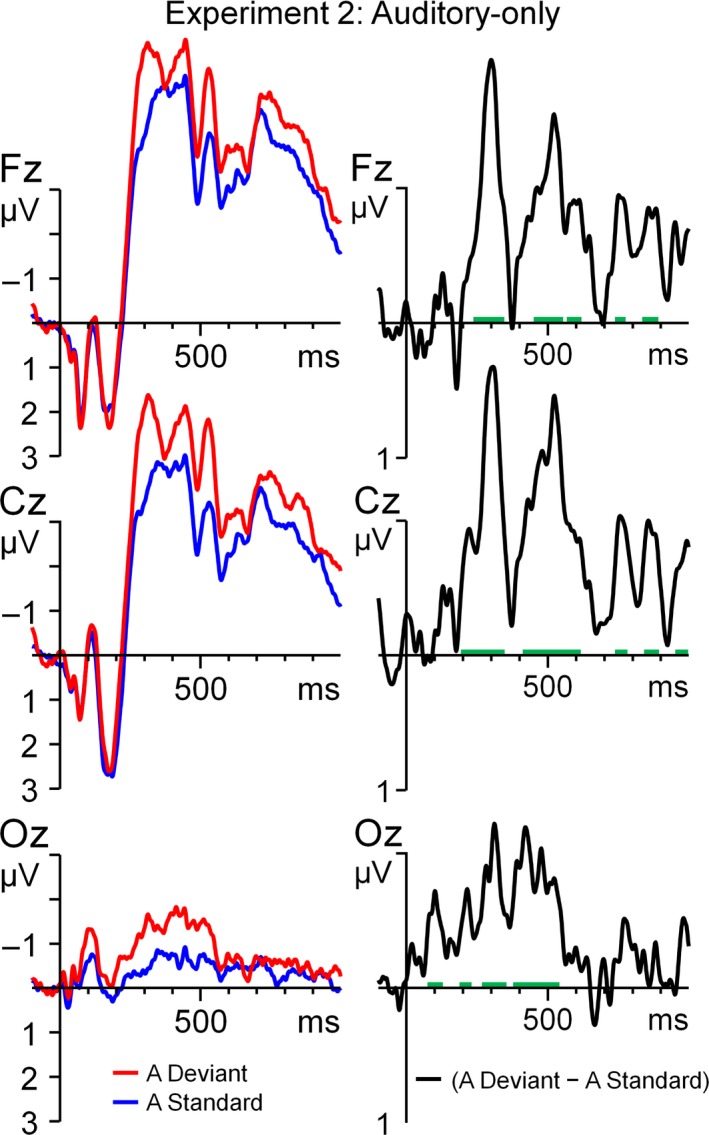
Figure 3.

Grand average ERPs for the A‐only experiment (Experiment 2), time‐locked to sound onset. The left panel shows the standard and deviant and the right panel the deviant–standard difference wave. The green trace indicates epochs where the difference wave significantly (P < 0.05) deviates from zero. [Colour figure can be viewed at http://www.wileyonlinelibrary.com/].
