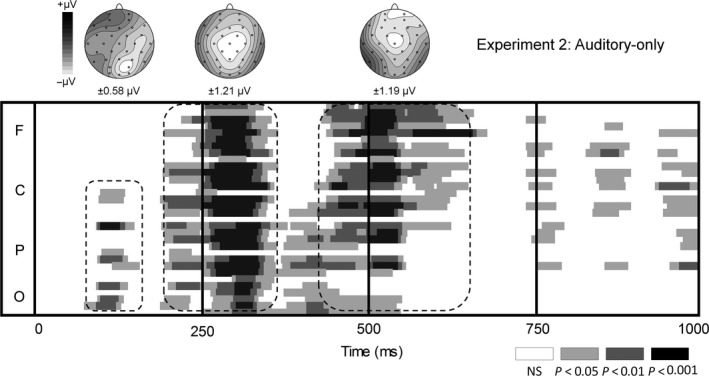
Figure 4.

Time course of the deviant − standard difference wave for the A‐only control experiment (Experiment 2) using pointwise t‐tests against prestimulus baseline at every electrode (frontal [F], central [C], parietal [P] and occipital [O]) and topographies (in μV) for the different phases in the MMN.
