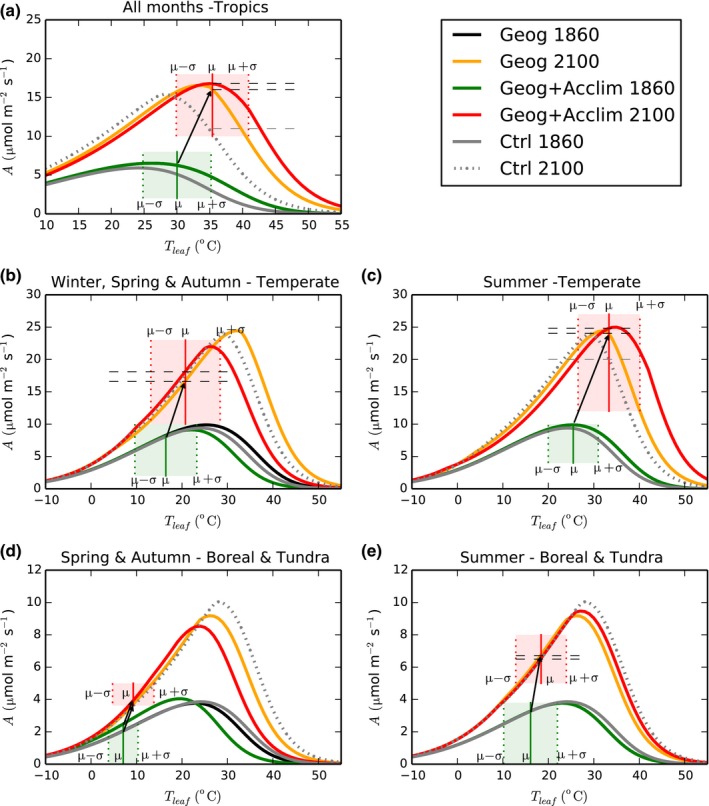
Figure 1.

Schematic representation of leaf‐level temperature response of light‐saturated gross photosynthesis by sunlit leaves using Ctrl, Geog and Geog+Acclim configurations on (a) a tropical forest (whole year), (b, c) temperate grassland (spring & autumn and summer months, respectively) and (d, e) shrub in the boreal & tundra region (spring & autumn and summer months, respectively) at pre‐industrial (continuous grey, black and green lines) and year 2100 (dotted grey, yellow and red lines) temperatures using an intermediate model in terms of predicted warming for illustrative purposes (gfdl_cm2). Note the scale differences across plant functional types (PFTs). The mean ± 1 SD (μ ± σ) of daytime hourly leaf temperature are represented in the green and red shaded boxes for the years 1860 and 2100, respectively. The black arrow represents the change in photosynthesis in Geog at the mean daytime temperature between 1860 and 2100. The dashed lines represent the extra carbon from acclimation at the mean daytime temperature in 2100.
