Figure 2.

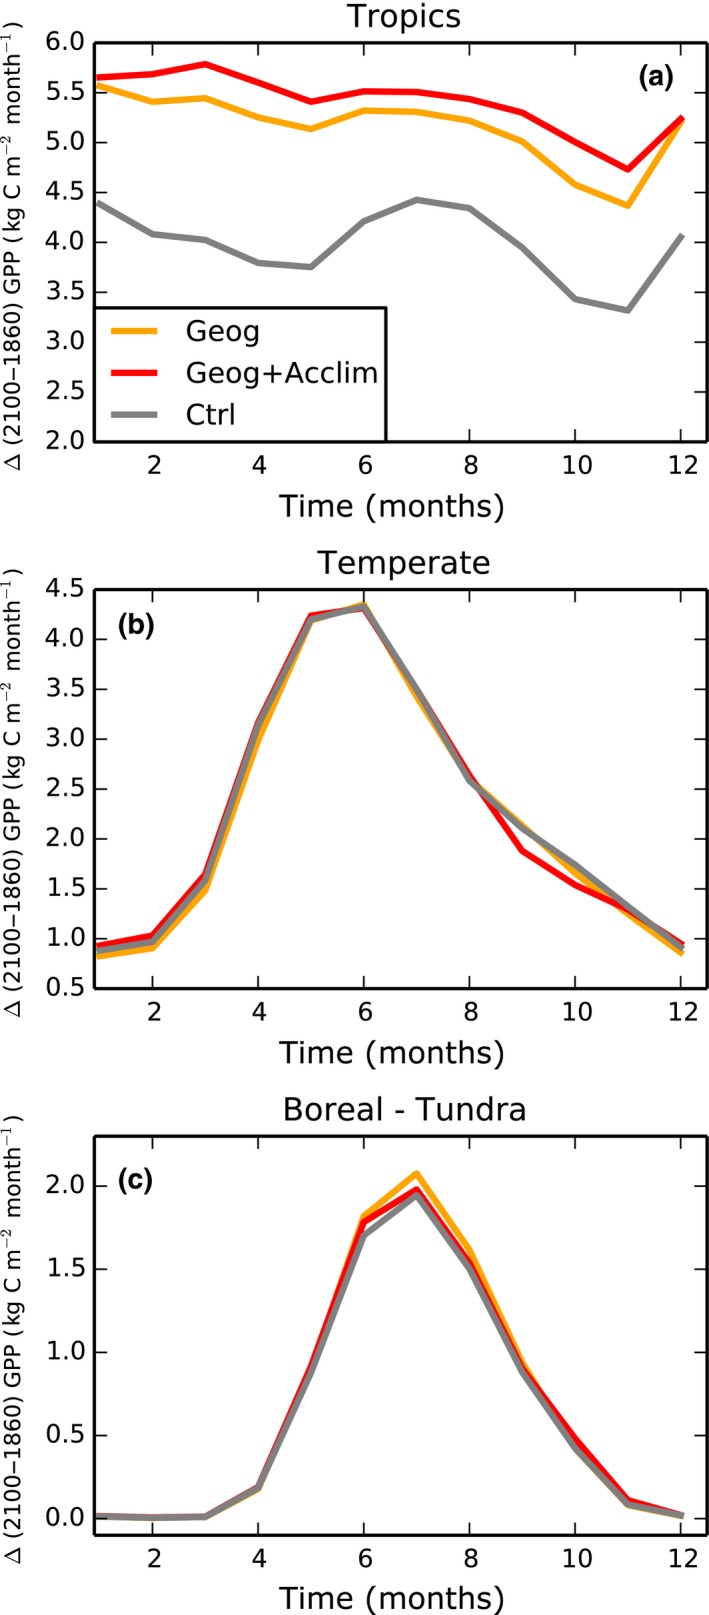
Change in simulated gross primary productivity (GPP) averaged for the (a) tropics, (b) temperate, and (c) boreal and tundra regions over the 1860–2100 period with climate from the gfdl_cm2 model. Note the differences in y‐axis scales.

Change in simulated gross primary productivity (GPP) averaged for the (a) tropics, (b) temperate, and (c) boreal and tundra regions over the 1860–2100 period with climate from the gfdl_cm2 model. Note the differences in y‐axis scales.