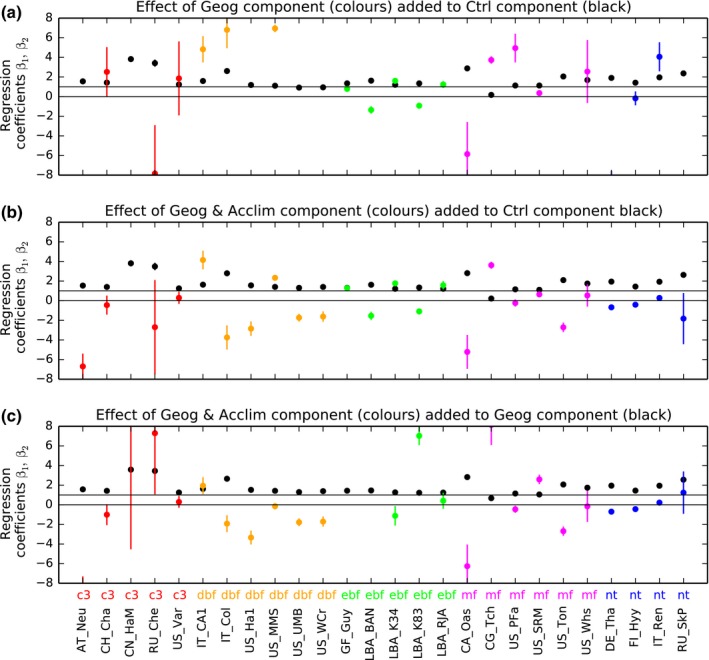
Figure 3.

Ecosystem‐level evaluation. Black dots are regression coefficient β 1 (Eqn (Eqn 6)) which in (a) and (b) are the component of Ctr simulations to observations, and in (c) are Geog simulations. Coloured dots (β 2 in Eqn (Eqn 6)) correspond to additional components, of (a) Geographical effects, (b) Geographical and acclimation effects, and (c) thermal acclimation effects only. Vertical lines correspond to the 95% confidence intervals on regression coefficients. Values of zero and unity are marked; values near unity suggest modelled effects may be observable in the measurements, and that its calculation is of the correct order of magnitude. Some sites had ‘β 2’ values out of the focal range on the vertical axis.
