
Figure 4.
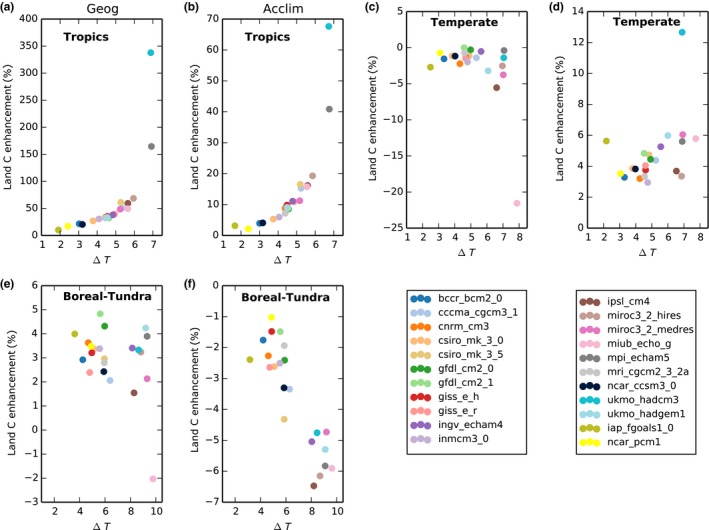
Simulated enhancement of land carbon storage due to (a, c, e) individual geographical and (b, d, f) acclimation effects for 22 global climate models (GCMs) as a function of the change in regional land surface temperature over the study period (ΔT). Rows represent regions: tropical (30°N < Lat < 30°S), temperate (60°N > Lat > 30°N and 60°S > Lat > 30°S) and boreal and tundra (60°S < Lat > 60°N) regions. Note the differences in y‐axis scales.