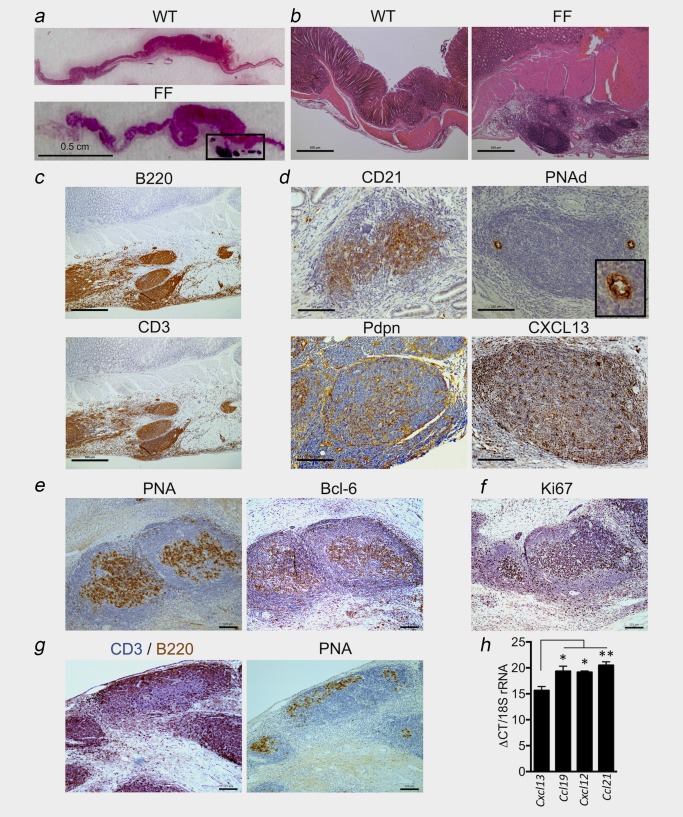
Figure 1.

Gastric tumourigenesis in gp130 F/F mice is associated with TLS development. (a and b) Representative haematoxylin and eosin (H&E) stained cross‐sections through the antral gastric region of 6‐month‐old gp130+/+ (WT) and gp130 F/F (FF) mice. Boxed region in (a) indicates cellular aggregates in the tumoural submucosa of gp130 F/F mice. (c) Representative immunohistochemistry of serial sequential sections showing co‐localisation of B220 (B cells) and CD3 (T cells) at lymphoid aggregates in 6‐month‐old gp130 F/F mice. (d) Representative immunohistochemistry of CD21, PNAd+ HEV with high‐power image inset, podoplanin (Pdpn) and CXCL13 at lymphoid aggregates in 6‐month‐old gp130 F/F mice. (e and f) Representative immunohistochemistry of peanut agglutinin (PNA) and Bcl‐6 in sequential sections (e) and the proliferative marker Ki67 (f) at germinal centres in 6‐month‐old gp130 F/F mice. (g) Dual staining for CD3 (purple) and B220 (brown) (left image) and PNA (right image) in sequential sections at lymphoid aggregates in 6‐month‐old gp130 F/F mice. PNA staining at germinal centres is seen in lymphoid aggregates displaying segregated B and T cell zones, and in less organised cellular aggregates. (h) Quantitative RT‐PCR (qPCR) analyses of Cxcl13, Ccl19, Cxcl12 and Ccl21 normalised to 18S rRNA and displayed as median qPCR cycle threshold (ΔCT) in RNA purified from laser capture microdissected submucosal lymphoid aggregates in 6‐month‐old gp130 F/F mice (n = 3). *p < 0.05; **p < 0.01. Scale bars: (a) 0.5 cm; (b and c) 500 µm; (d–g) 125 µm. [Color figure can be viewed at http://wileyonlinelibrary.com]
