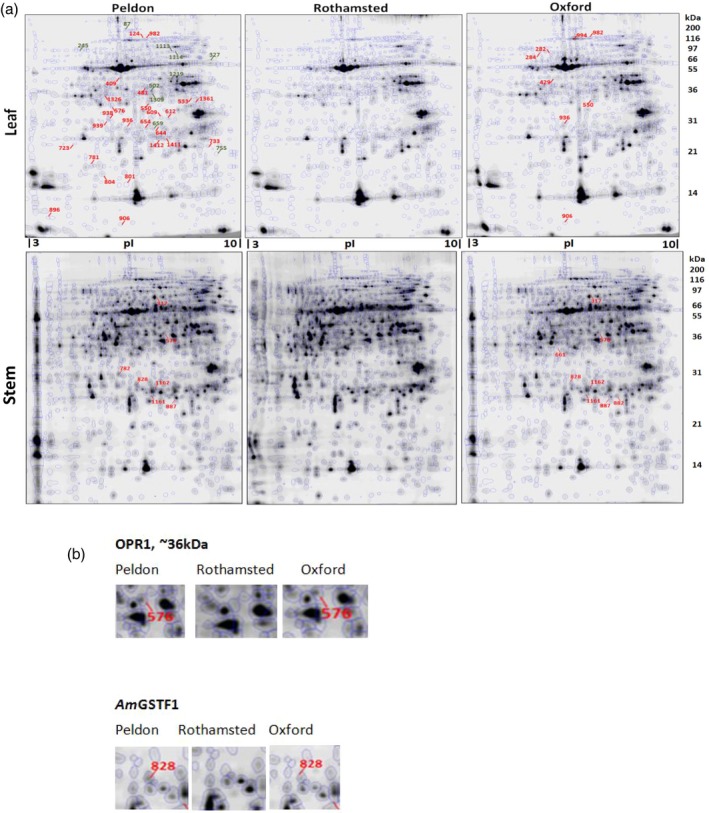
Figure 1.

Proteome maps for leaf and stem tissue of NTSR (Peldon, Oxford) and HS (Rothamsted) blackgrass populations.
(a) Polypeptide spots that were significantly enhanced (+1.5‐fold) in the NTSR populations compared to the HS are numbered and indicated on the maps.
(b) Two representative protein spots illustrating their increased synthesis in the two NTSR populations.
