
Figure 2.
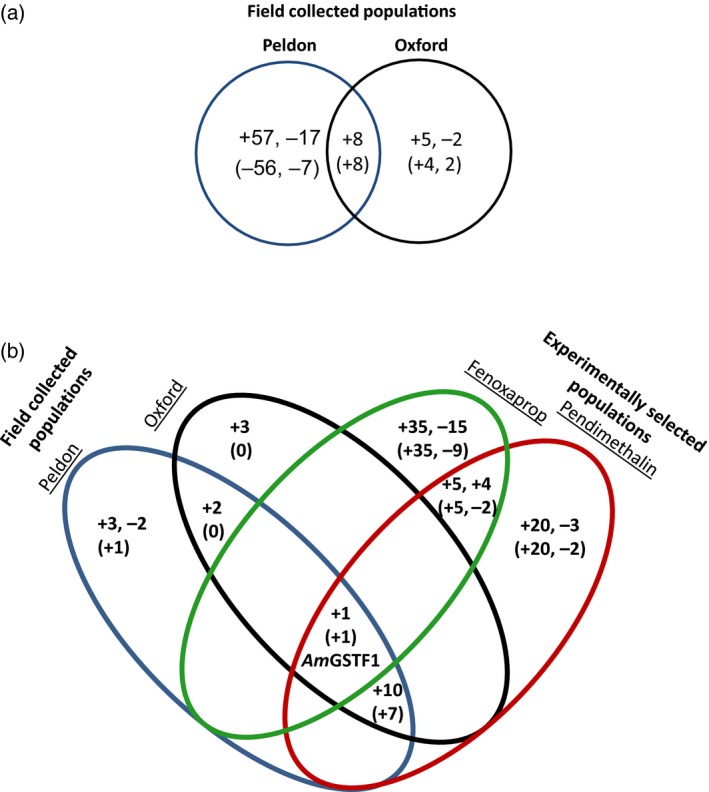
Number of (a) leaf and (b) stem polypeptide spots differentially changed in their abundance [increased (+) or reduced (−)] in NTSR populations compared with HS plants. This includes polypeptides that were differentially abundant in HS plants exposed to biotic and abiotic stress. Numbers in brackets denote polypeptides that were not differentially expressed under HS stress conditions. Only one protein (AmGSTF1) was found to be differentially enhanced in all four NTSR populations in stem tissue.