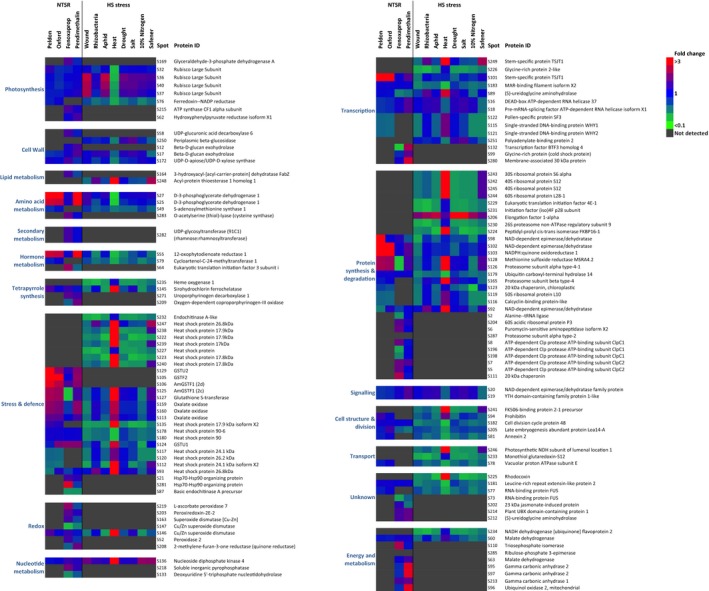
Figure 3.

Functional categorization and abundance of NTSR and HS stress response proteins detected in stem tissue relative to HS control plants.
Proteins not detected in a population or stress condition are shaded black; blue represents no differential abundance, red and green represent increased or decreased abundance respectively. This finding indicates that protein spots with increased abundance in NTSR populations were either not differentially enhanced, or were depressed in the HS plants exposed to stress treatments.
