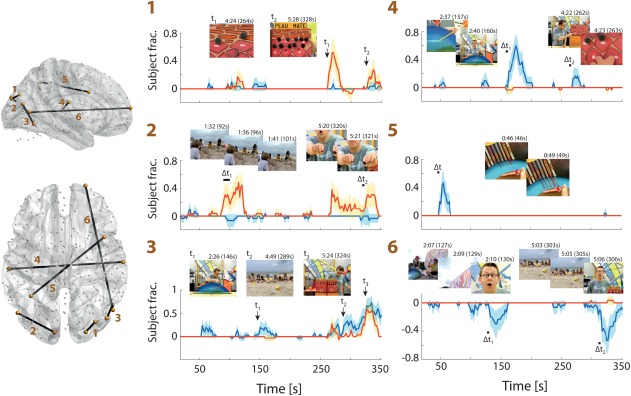
Figure 3.

ISFC excursion time courses for selected connections. (Left) Sagittal and horizontal brain slices depicting the connections (from 1 to 6) chosen for display. (Right) For TD (blue) or ASD (red) subjects, ISFC excursion time courses for the selected connections are displayed with two‐tailed 95% confidence intervals. In each case, for the most salient ISFC transients, the movie time points that triggered the changes are highlighted by an arrow (for one frame) or a horizontal bar (for a subset of frames). Illustrations of the related frames are also displayed at the top of each plot, along with their time of occurrence. Note that an ISFC estimate is drawn at the last movie time point that was included to compute it [Color figure can be viewed at http://wileyonlinelibrary.com]
