
Figure 4.
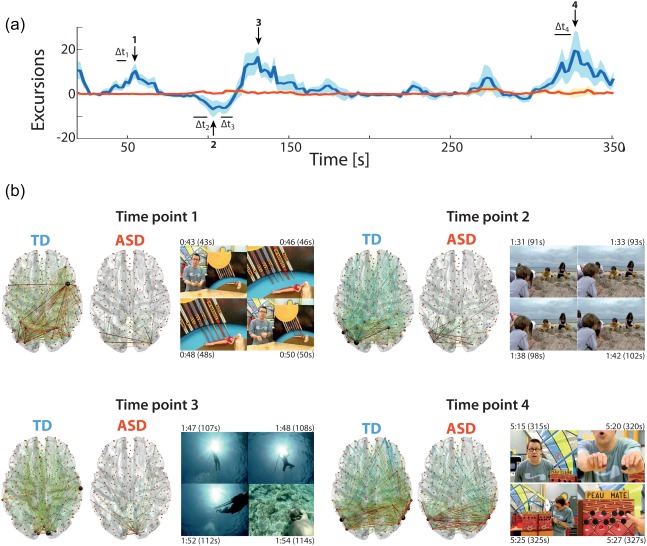
Whole‐brain ISFC transient patterns. (a) ISFC excursion time courses for TD (blue) or ASD (red) subjects, summed across all connections retained as group‐specific. Peak time points (from 1 to 4) are labeled by vertical arrows, and the movie frames that triggered the ISFC changes are labeled by horizontal bars. Note that an ISFC estimate is drawn at the last movie time point that was included to compute it. (b) For the selected time points, whole‐brain horizontal depiction of the connections that were undergoing significant ISFC excursions in TD (left slice) and ASD (right slice) subjects, and example frames from the movie time span that triggered the appearance of the pattern (right panel), with annotated times at which the frames occurred. Stroke thickness in the brain plots is proportional to the fraction of subjects that showed a significant ISFC increase (in red) or decrease (in blue). The size and color of the spheres are proportional to nodal degree. TD and ASD brain plots from the same time point are at the same scale, and can thus directly be compared for edge thickness and node size [Color figure can be viewed at http://wileyonlinelibrary.com]