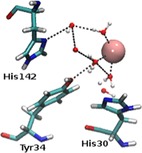
Figure 2.

MnSOD‐3[Q142H] second sphere residues, His142, Tyr34 and His30 observed from Molecular Dynamics (MD) simulation. This particular frame of the protein trajectory reveals ND1 and NE2 of His142 in a position that is opposed to what is observed in the X‐ray structure of this protein. Here, ND1 is closer to the inner‐sphere waters. Red and white spheres indicate waters, while manganese is indicated by a pink sphere. Hydrogen bonding is illustrated as black dashes. This Figure was generated by VMD.13 See supporting information for the trajectory.
