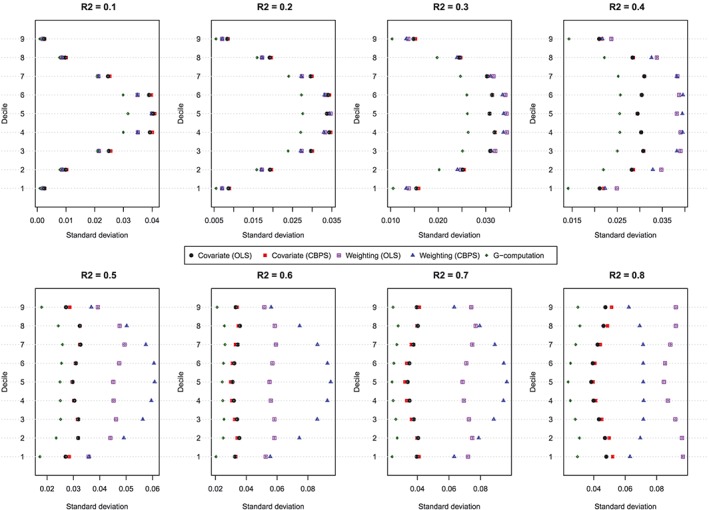
Figure 6.

Standard deviation of estimated dose‐response function at the deciles of treatment (N = 500). CBPS, covariate balancing propensity score; OLS, ordinary least squares [Colour figure can be viewed at http://wileyonlinelibrary.com]

Standard deviation of estimated dose‐response function at the deciles of treatment (N = 500). CBPS, covariate balancing propensity score; OLS, ordinary least squares [Colour figure can be viewed at http://wileyonlinelibrary.com]