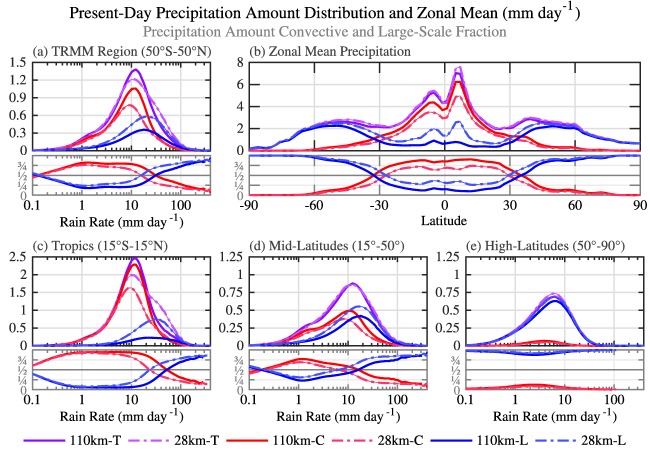
Figure 3.

Annual precipitation amount distributions from (a) 50°S to 50°N (c) 15°S to 15°N, (d) 15° to 50°, (e) 50° to 90°, and (b) zonal mean precipitation of present‐day daily rates for CAM at 110 km (dark‐solid) and 28 km (light‐dashed) horizontal resolutions of total (T, purple), convective (C, red), and large‐scale (L, blue) contributions; lower subplots show fractional contributions of convective and large‐scale precipitation to total precipitation. The units for all plots are mm d−1 (as given in the figure title), however the amount distributions are scaled by ΔlnR−1, where ΔlnR = ΔR/R, which has units of mm d−1/mm d−1 and is thus a unitless scaling term.
