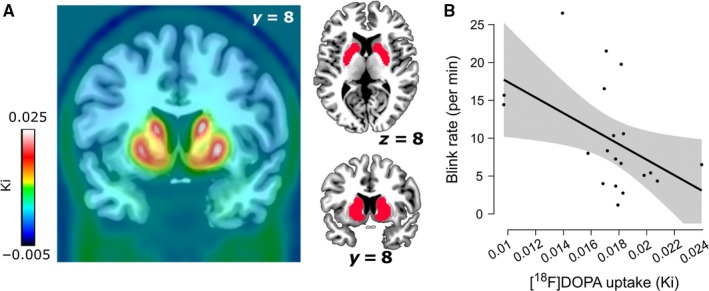
Figure 1.

Main results: mapping of dopamine synthesis capacity and relationship with spontaneous eye blink rate in the striatum. (A) On the left, whole‐brain map of mean Ki values across the 20 participants included in the analyses. On the right, the striatal functional mask used for the region‐of‐interest analyses is depicted in red. (B) Negative correlation between spontaneous eye blink rate and Ki values in the striatal mask (⍴ = −0.504, P = 0.024). The shaded area represents the 95% confidence interval. Note that the P‐value of the negative correlation drops below significance (⍴ = −0.417, P = 0.096) when removing the three most extreme Ki values (highest Ki value and two lowest Ki values, respectively 2.1 and 2.4 standard deviations away from the mean). [Colour figure can be viewed at http://www.wileyonlinelibrary.com/].
