
Figure 2.
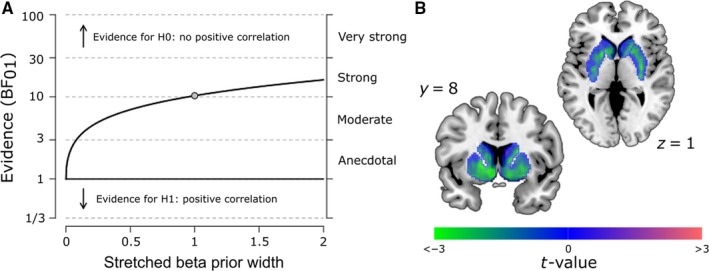
Control and exploratory analyses. (A) Robustness check for the Bayesian correlation analysis. This graph shows that the Bayes factor quantifying the relative evidence for the absence vs. presence of a positive correlation exceeds the critical threshold of 3 for a large range of beta prior widths, even extending to strong prior beliefs in the existence of a positive correlation (values < 1 correspond to a prior biased in favour of a positive correlation, values > 1 correspond to a prior biased in favour of an absence of a positive correlation and value = 1 corresponds to an uninformative (flat) prior as used in our main analysis). (B) Unthresholded t‐map resulting from a voxel‐wise analysis investigating the relationship between sEBR and Ki values in an anatomical mask of the striatum. Note that almost all t‐values (including those that do not reach statistical significance) are negative, illustrating that the relationship between sEBR and dopamine synthesis capacity is negative across a large portion of the striatum. This negative relationship shows a significant peak in the left nucleus accumbens (x, y, z = −8, 10, −6), surviving a voxel‐wise FWE‐corrected threshold of P < 0.05 within the striatal mask. [Colour figure can be viewed at http://www.wileyonlinelibrary.com/].