
Figure 4.
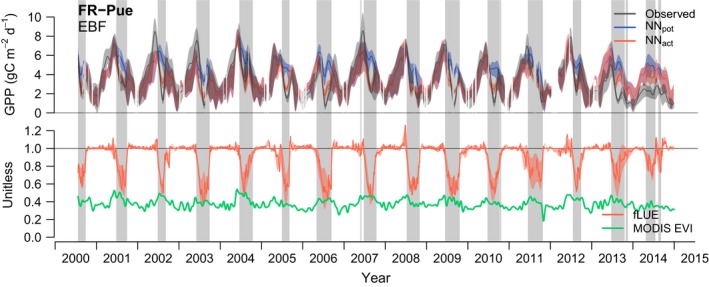
Time series for site ‘FR‐Pue’ (more sites are shown in Supporting Information Fig. S4). Upper panel: time series of observed values and neural network (NN)‐based estimates of gross primary productivity (GPP). Curves are splined daily values with shaded ranges representing splines of minimum and maximum values within 7‐d sliding windows. Lower panel: fractional reduction in light use efficiency due to soil moisture (fLUE) and the fraction of absorbed photosynthetically active radiation (fAPAR) based on MODIS Enhanced Vegetation Index (EVI) data. The shaded range around fLUE represents the splined minimum and maximum fLUE across its quantifications based on different soil moisture datasets, and the solid line is its mean. The site name is given in the upper left corner, together with the vegetation type (EBF, evergreen broadleaved forest). Grey vertical bars illustrate periods identified as ‘droughts’, that is, where fLUE falls below a site‐specific threshold (see the Materials and Methods section).