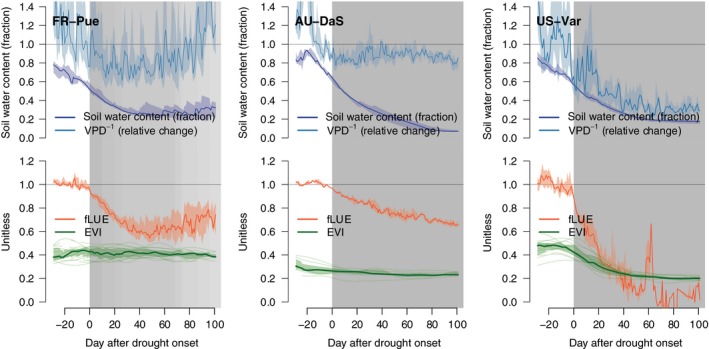
Figure 5.

Evolution of soil moisture and vapour pressure deficit (VPD, given in the top panel of each sub‐plot) and fractional reduction in light use efficiency (fLUE, red) and MODIS Enhanced Vegetation Index (EVI) data (second panel, green) throughout drought events. Values shown by VPD −1 (light blue) are calculated by first normalizing values relative to the median of VPD values during 20 d before drought onset and then taking the inverse. Soil moisture values are not normalized, but represent a fraction of water‐holding capacity. Coloured shaded ranges represent the upper and lower quartiles across drought events. The vertical grey shading illustrates the length of individual fLUE drought events. Darker grey shades indicate multiple aligned drought events.
