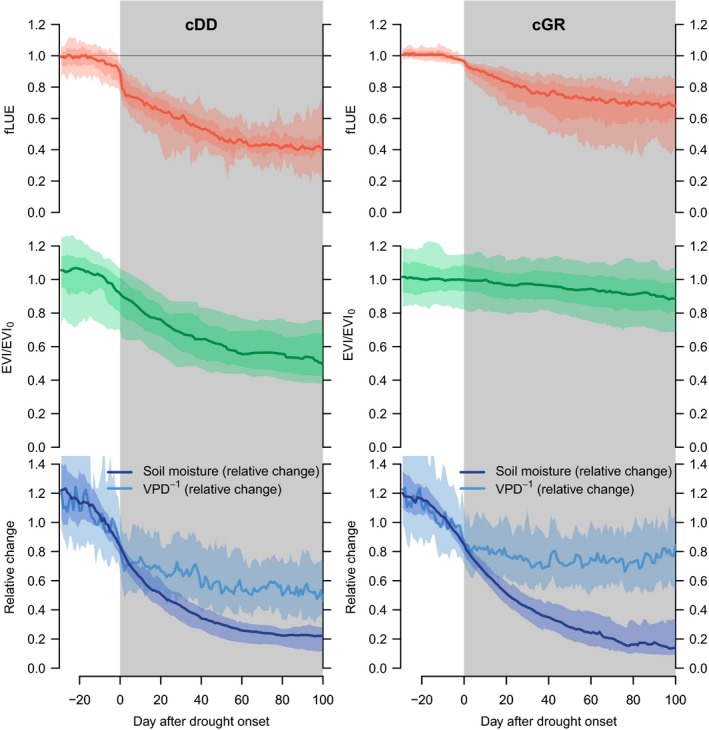
Figure 6.

Evolution of variables throughout drought periods, aggregated by clusters cDD (left, drought‐deciduous cluster) and cGR (right, evergreen cluster). Top: fractional reduction in light use efficiency (fLUE). Middle: changes in Enhanced Vegetation Index (EVI), relative to its value before the onset of droughts (median across preceding 20 d). Bottom: changes in soil moisture and vapour pressure deficit (VPD), relative to values before the onset of droughts (median across preceding 20 d). VPD −1 is shown here for a better comparison with soil moisture variations and is calculated as the inverse of the relative VPD change. Data are aligned by the drought onset and aggregated across each event and site in the respective cluster. Bold lines represent the median, and shaded areas represent the upper and lower 10% and 25% quantiles across all events and all sites pooled within a cluster.
