
Figure 7.
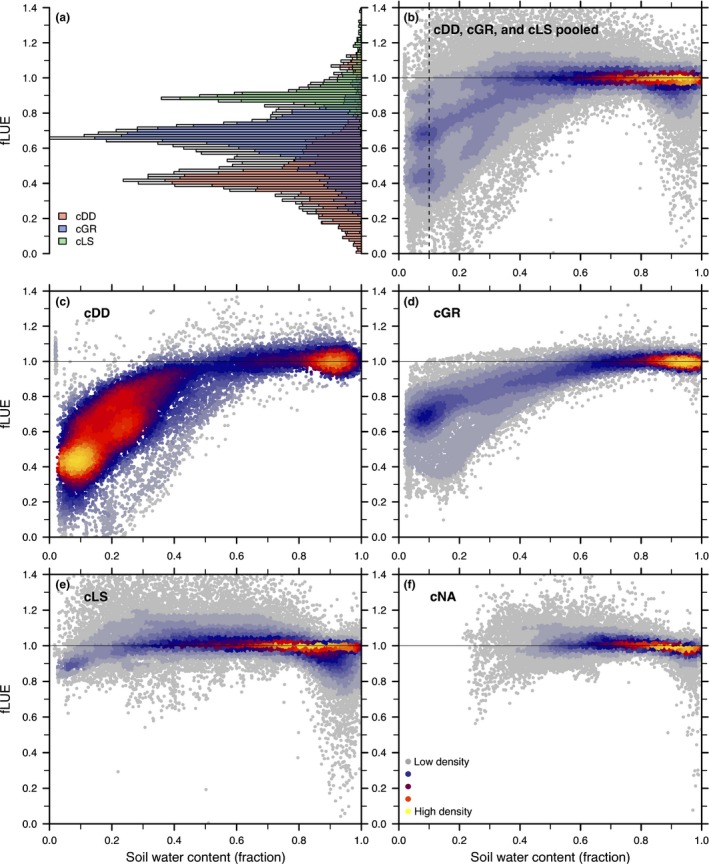
Functional relationship of the fractional reduction in light use efficiency due to soil moisture (fLUE) vs soil moisture by cluster. (a) Distribution of fLUE values at a fractional soil water content below 0.1. Grey bars represent pooled data from drought‐deciduous (cDD), evergreen (cGR) and low sensitivity (cLS) clusters. Coloured bars represent data by clusters. (b) Functional relationship of fLUE vs soil moisture for pooled data from clusters cDD, cGR and cLS. (c–f) Functional relationship by cluster. Colours in the point cloud represent a Kernel Density Estimation (R package ‘lsd’; Schwalb et al., 2015) and visualize overlapping points.