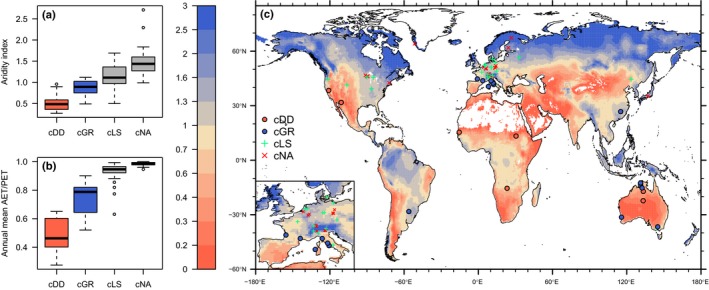
Figure 8.

(a) Aridity index by cluster, defined as the ratio of annual precipitation (P) over potential evapotranspiration (PET), here calculated for all years in which data were available for the respective sites. Precipitation data are from the FLUXNET 2015 Tier 1 dataset; PET is calculated following the Priestly–Taylor equation, as implemented in the SPLASH model (Davis et al., 2017). Clusters are defined based on vegetation responses to drought, with cDD referring to drought‐deciduous, cGR to evergreen, and cLS to vegetation with low sensitivity to low soil moisture. Sites in cNA are not affected by low soil moisture. (b) Annual mean actual evapotranspiration (AET) over PET by cluster. AET and PET are calculated using the SPLASH model (Davis et al., 2017). (c) Distribution of sites and clusters across the globe. Colours of land areas represent the aridity index (P/PET) with data from (Greve et al., 2014). In (a,b), boxes represent the interquartile range of values (Q 25, Q 75,), whiskers cover Q 25 − 1.5 × (Q 75 − Q 25) to Q 75 + 1.5 × (Q 75 − Q 25).
