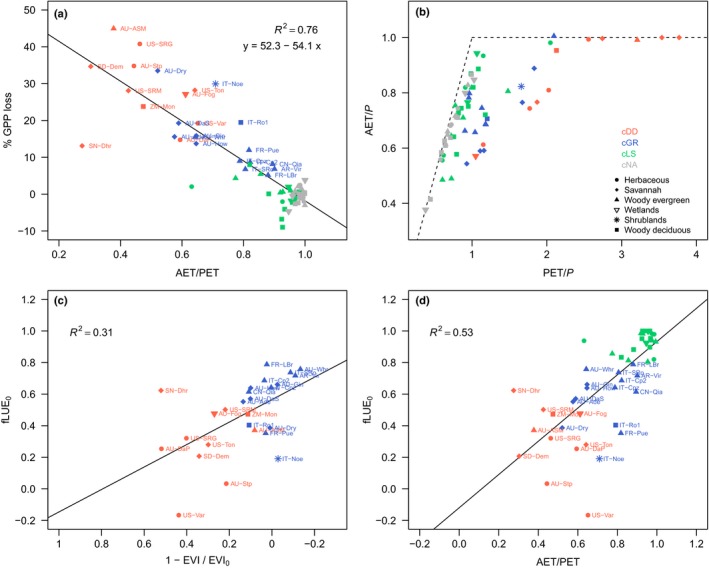
Figure 9.

(a) Average annual gross primary productivity (GPP) loss due to soil moisture effects vs the annual average ratio of actual over potential evapotranspiration (AET/PET). (b) Sites in Budyko space (P is annual total precipitation). (c) Maximum reduction in the fractional reduction in light use efficiency (fLUE) with soil moisture approaching zero (fLUE 0) vs greenness change. 1 − EVI/EVI 0 quantifies the degree of drought‐deciduousness of the vegetation (EVI (Enhanced Vegetation Index) quantifies vegetation greenness, MODIS data), quantified as the relative reduction in greenness during fLUE droughts. Values of 1 − EVI/EVI 0 = 0 represent no response in greenness during fLUE drought events. The black line represents a linear fit to values from sites in clusters cDD and cGR. (d) fLUE 0 vs AET/PET. The black line represents a linear fit to values from sites in clusters cDD, cGR and cLS. Clusters are defined based on vegetation responses to drought, with cDD referring to drought‐deciduous, cGR to evergreen, and cLS to vegetation with low sensitivity to low soil moisture. Sites in cNA are not affected by low soil moisture. Symbols represent vegetation types, colours represent clusters (see legend in b).
